Switzerland's GDP showcases a consistent upward trajectory, reflecting its robust financial services sector, stable governance, and high-value industries. From $11.7 billion in 1961, GDP surged during the 1970s, reaching $65.4 billion in 1975, fueled by industrial growth and its role as a global financial hub. The oil crisis impacted growth briefly but was followed by recovery in the 1980s, with GDP peaking at $215.5 billion in 1988.
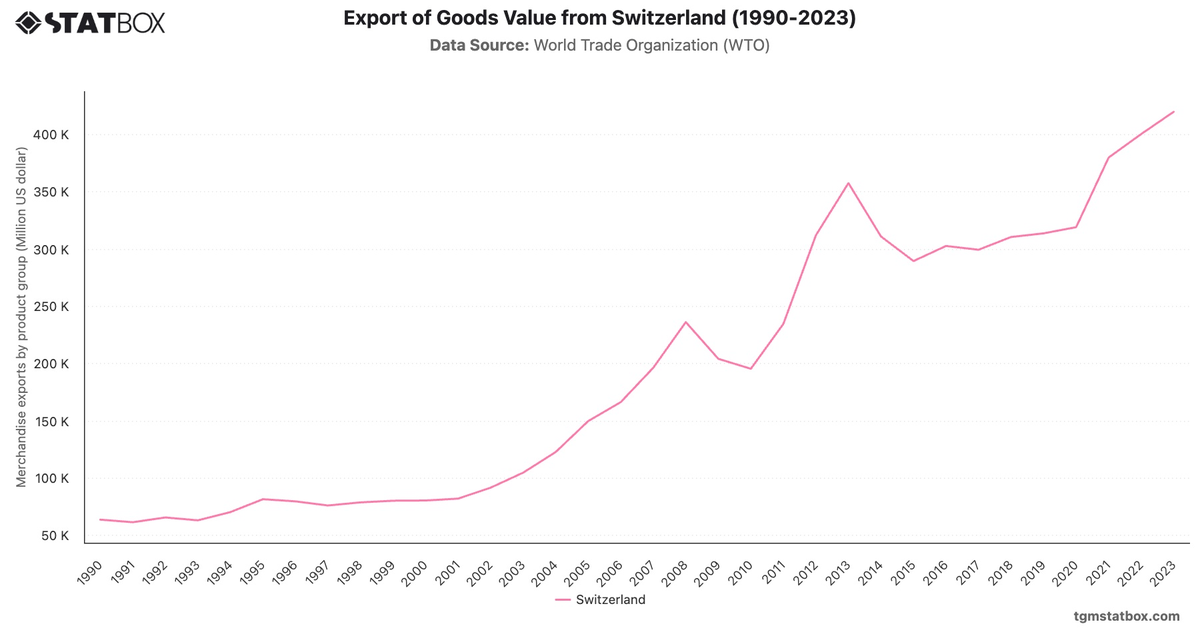
The 1990s highlighted a strong post-Cold War economy, with GDP reaching $352.8 billion by 1995. Despite global financial challenges, Switzerland's economy adapted through innovation and exports, particularly in pharmaceuticals. By 2023, GDP hit $884.9 billion, demonstrating resilience amidst global uncertainties like the COVID-19 pandemic and inflationary pressures.
The 1990s highlighted a strong post-Cold War economy, with GDP reaching $352.8 billion by 1995. Despite global financial challenges, Switzerland's economy adapted through innovation and exports, particularly in pharmaceuticals. By 2023, GDP hit $884.9 billion, demonstrating resilience amidst global uncertainties like the COVID-19 pandemic and inflationary pressures.
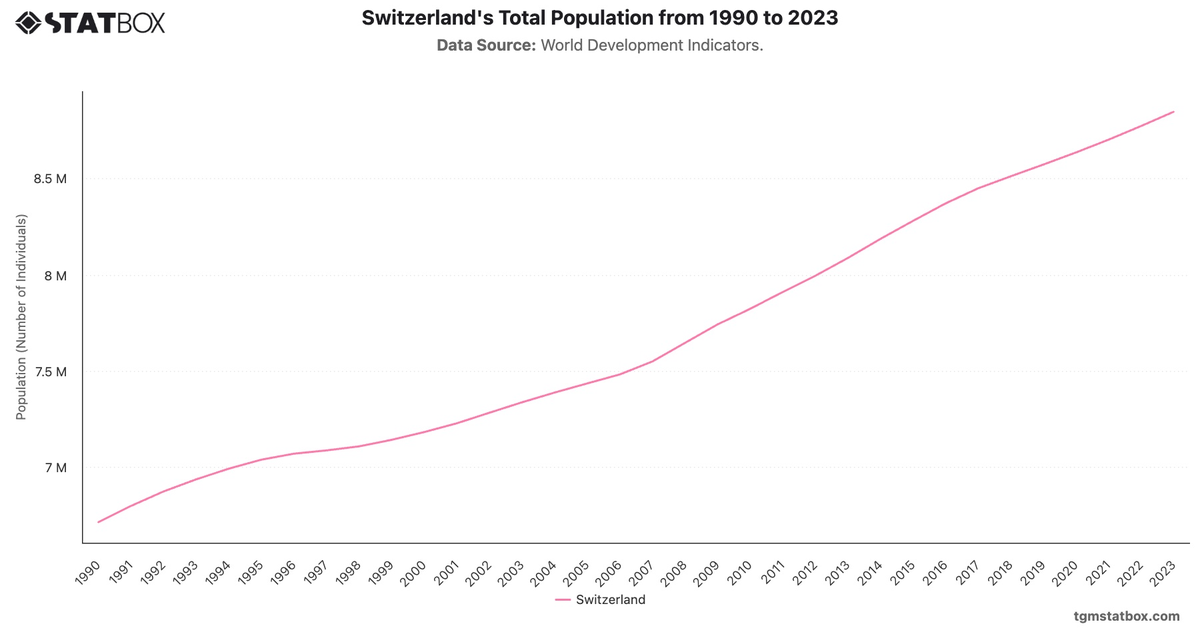
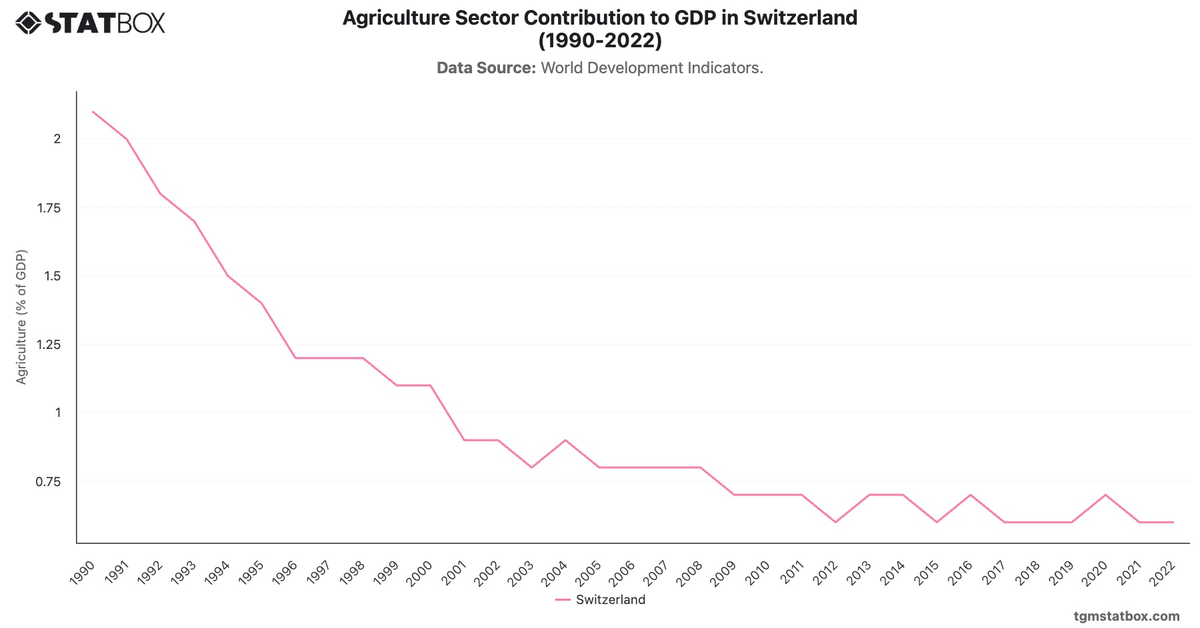
Gain a broader perspective by reviewing Switzerland’s population trends, Agriculture’s share in Switzerland’s GDP, Switzerland’s manufacturing sector GDP share.