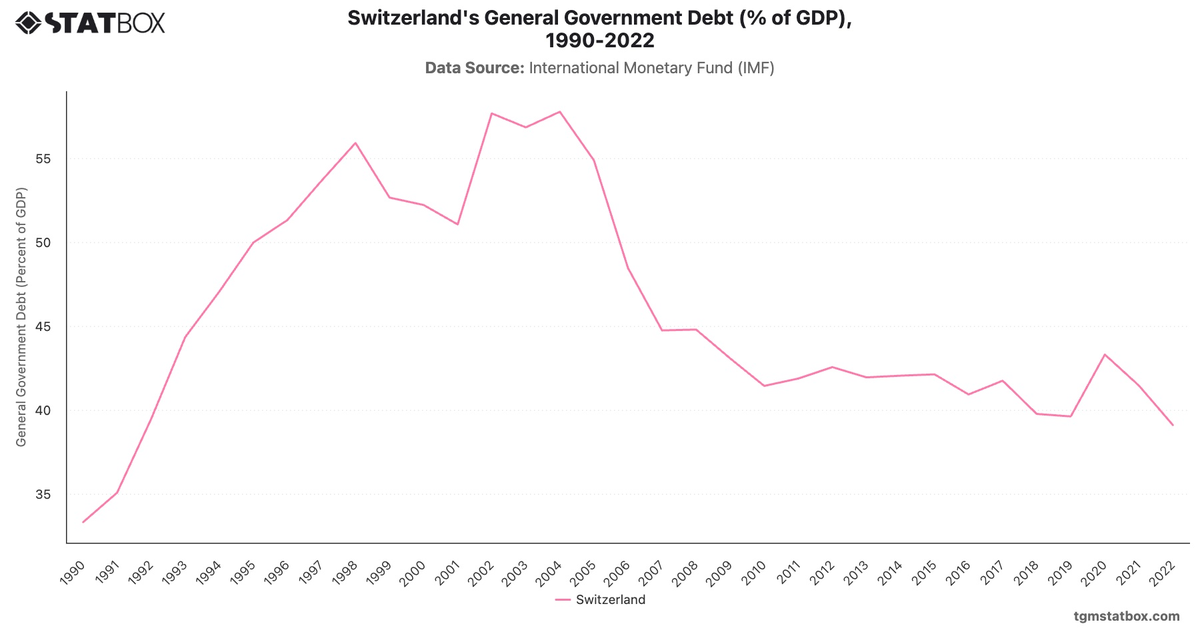
Switzerland's fiscal trends demonstrate stability and prudence. Deficits during the 1990s peaked at -3.1% in 1993 but were followed by a return to surpluses by 2006, driven by robust economic policies. A surplus of 1.9% in 2008 highlighted Switzerland’s resilience during the global financial crisis.
The COVID-19 pandemic caused a temporary deficit of -3.0% in 2020, but recovery has been swift, with surpluses projected to stabilize around 0.2% from 2025 onward. Switzerland’s fiscal discipline ensures long-term sustainability.
The COVID-19 pandemic caused a temporary deficit of -3.0% in 2020, but recovery has been swift, with surpluses projected to stabilize around 0.2% from 2025 onward. Switzerland’s fiscal discipline ensures long-term sustainability.
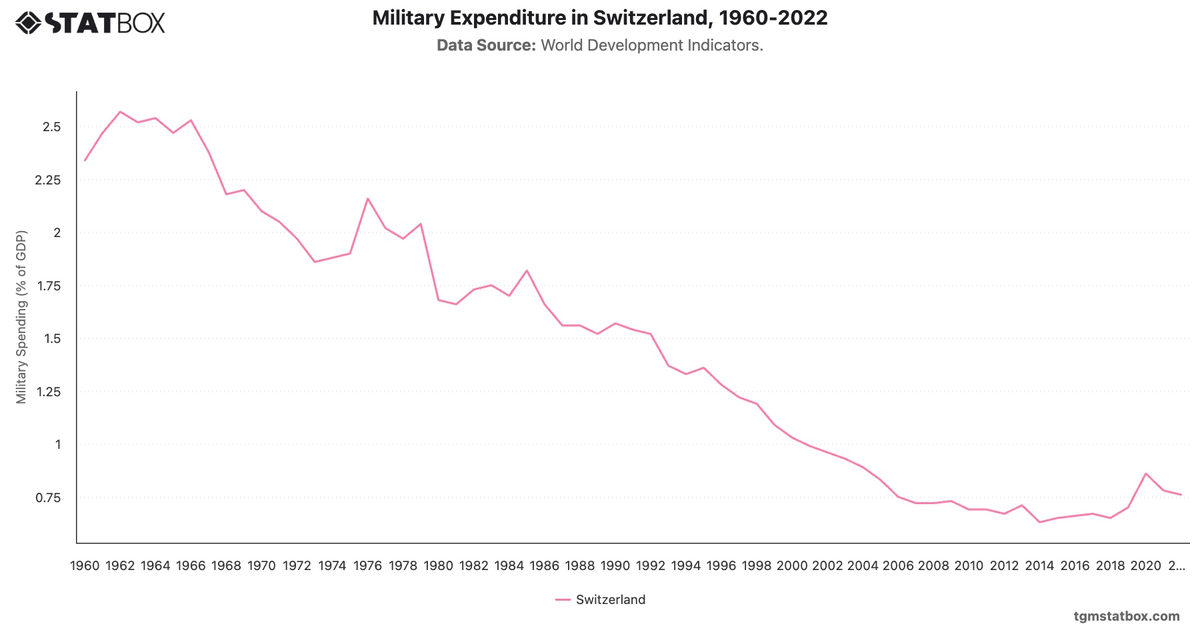
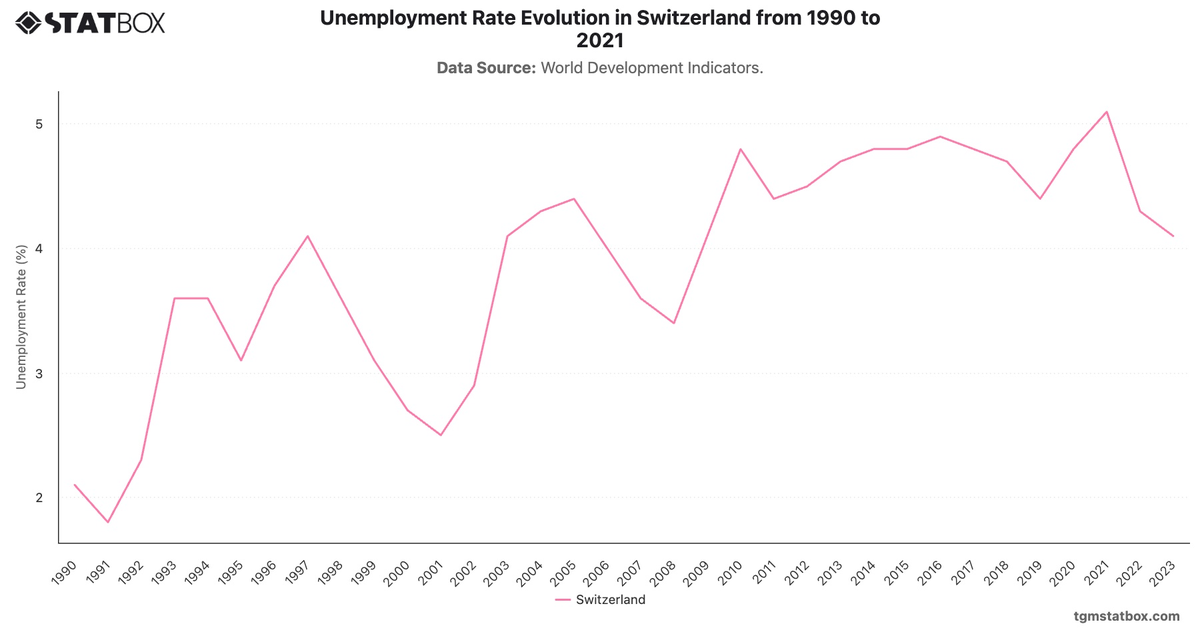
Gain a broader perspective by reviewing Switzerland’s unemployment rate trend, Switzerland’s annual GDP growth rate, Switzerland’s military spending.