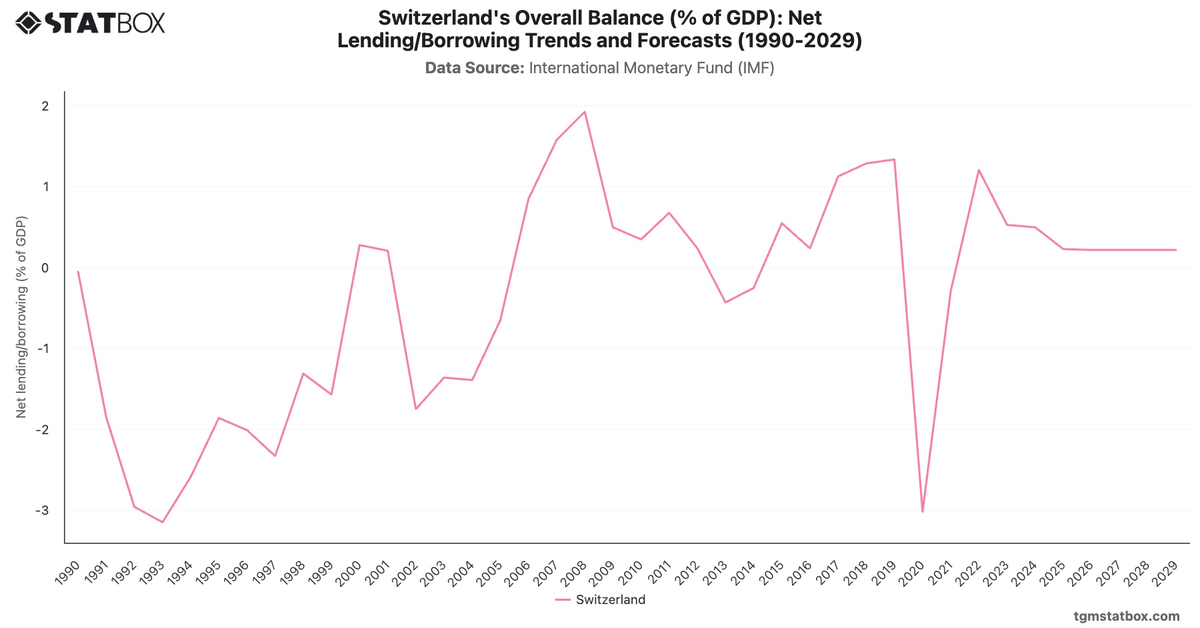
Switzerland’s general government debt ratio rose moderately in the early 1990s, from 33.3% in 1990 to around 56% by 1998. This gradual increase was due to economic stabilization efforts amid global financial fluctuations. Switzerland implemented debt brakes in the early 2000s, enabling it to manage public debt more effectively, resulting in a reduction from 56% in 1998 to around 40% by the mid-2010s.
The slight increase to 43.3% in 2020 was a direct result of the COVID-19 pandemic as Switzerland introduced fiscal packages to counteract the economic impact. By 2022, the debt ratio had once again declined to 39.1%, demonstrating Switzerland's fiscal prudence and effective debt management strategies despite the global economic pressures of recent years.
The slight increase to 43.3% in 2020 was a direct result of the COVID-19 pandemic as Switzerland introduced fiscal packages to counteract the economic impact. By 2022, the debt ratio had once again declined to 39.1%, demonstrating Switzerland's fiscal prudence and effective debt management strategies despite the global economic pressures of recent years.
For a broader context, visit other statistics on Switzerland’s mortality rate, military personnel share in Switzerland’s population, Switzerland’s manufacturing sector GDP share.