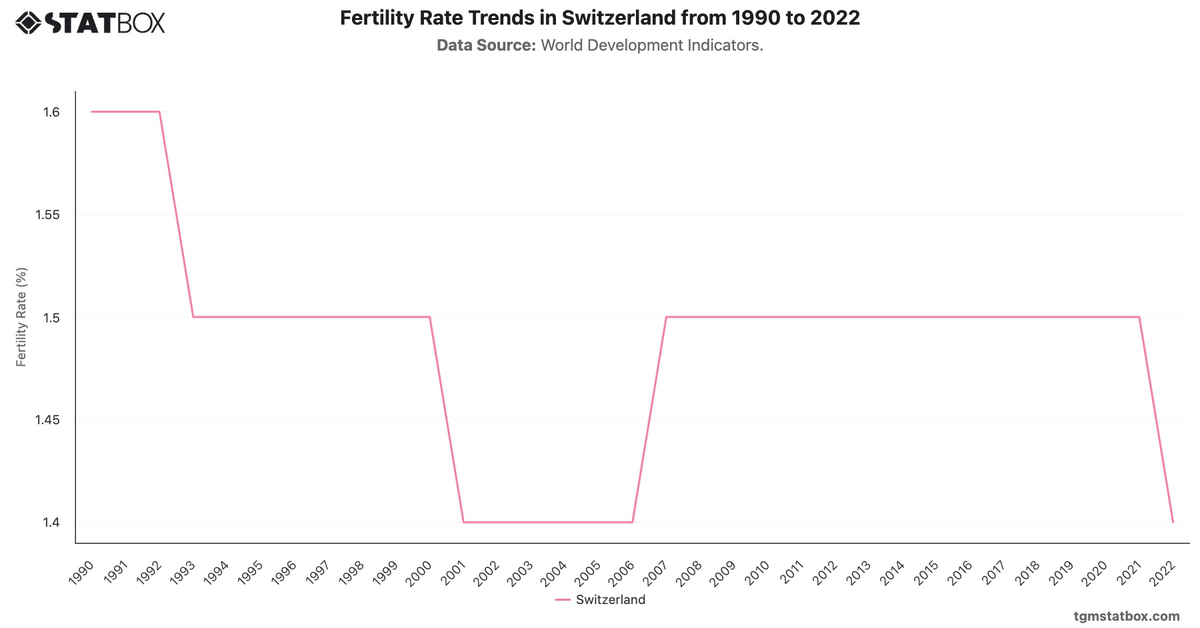
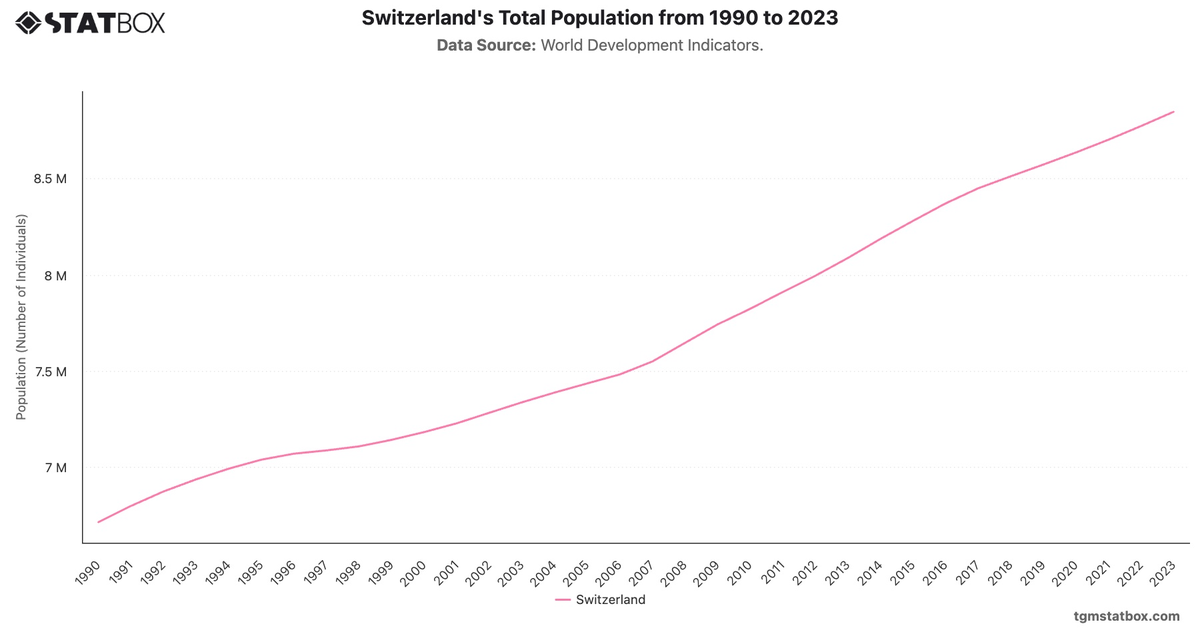
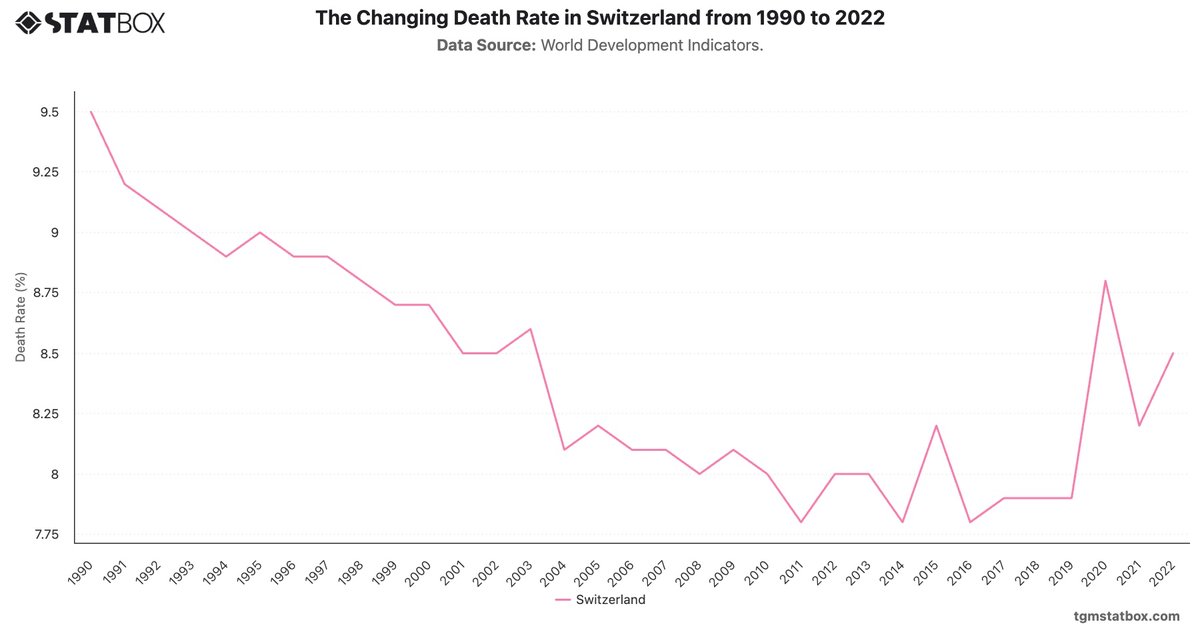
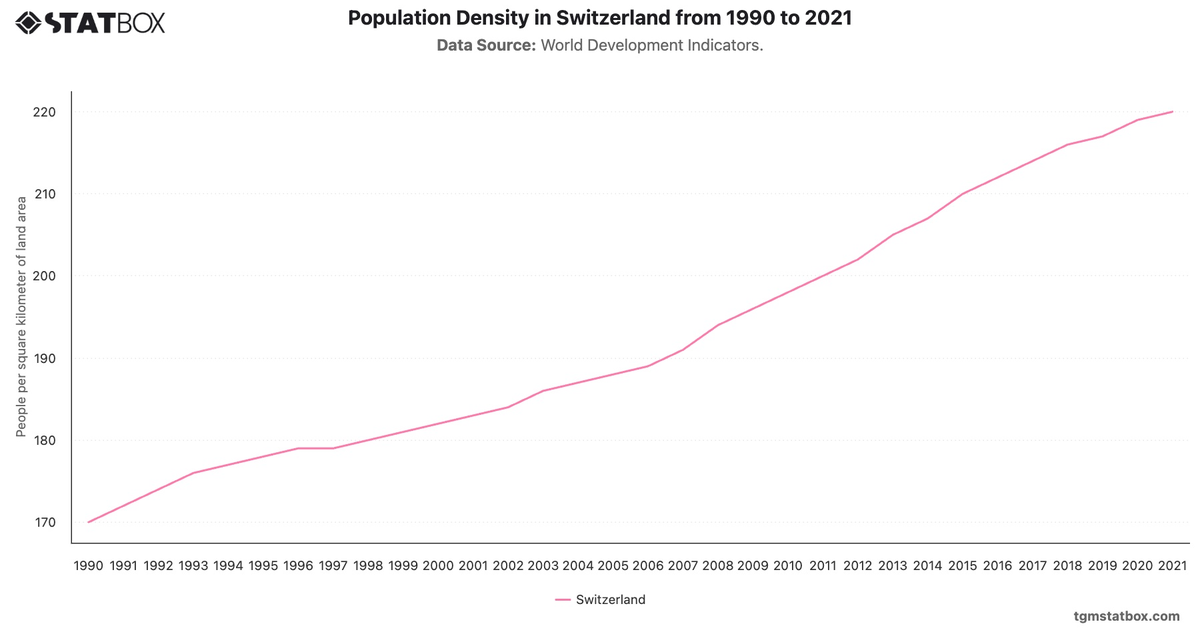
Switzerland's population growth rate exhibited gradual fluctuations from 1990 to 2023, reflecting a balance between natural population increase and immigration. The early 1990s saw a relatively high growth rate, peaking at 1.2% in 1991, supported by strong economic performance and immigration. However, growth rates declined steadily throughout the decade, reaching a low of 0.2% in 1997, partly due to economic stagnation and stricter immigration policies.
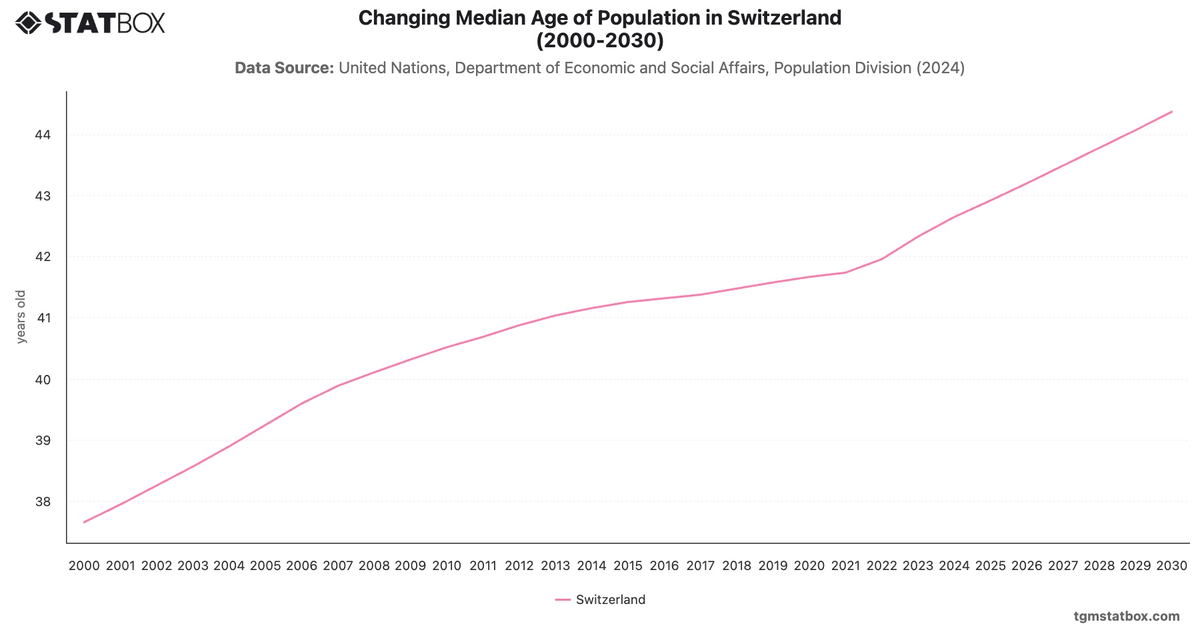
The early 2000s marked a period of recovery, with growth climbing to 1.3% in 2008, driven by economic expansion and Switzerland's reputation as a global financial hub. Recent years have seen stabilization, with rates holding at 0.7%-0.8% from 2018 to 2023. This stability reflects controlled immigration policies and Switzerland's demographic shift towards an aging population.
The early 2000s marked a period of recovery, with growth climbing to 1.3% in 2008, driven by economic expansion and Switzerland's reputation as a global financial hub. Recent years have seen stabilization, with rates holding at 0.7%-0.8% from 2018 to 2023. This stability reflects controlled immigration policies and Switzerland's demographic shift towards an aging population.
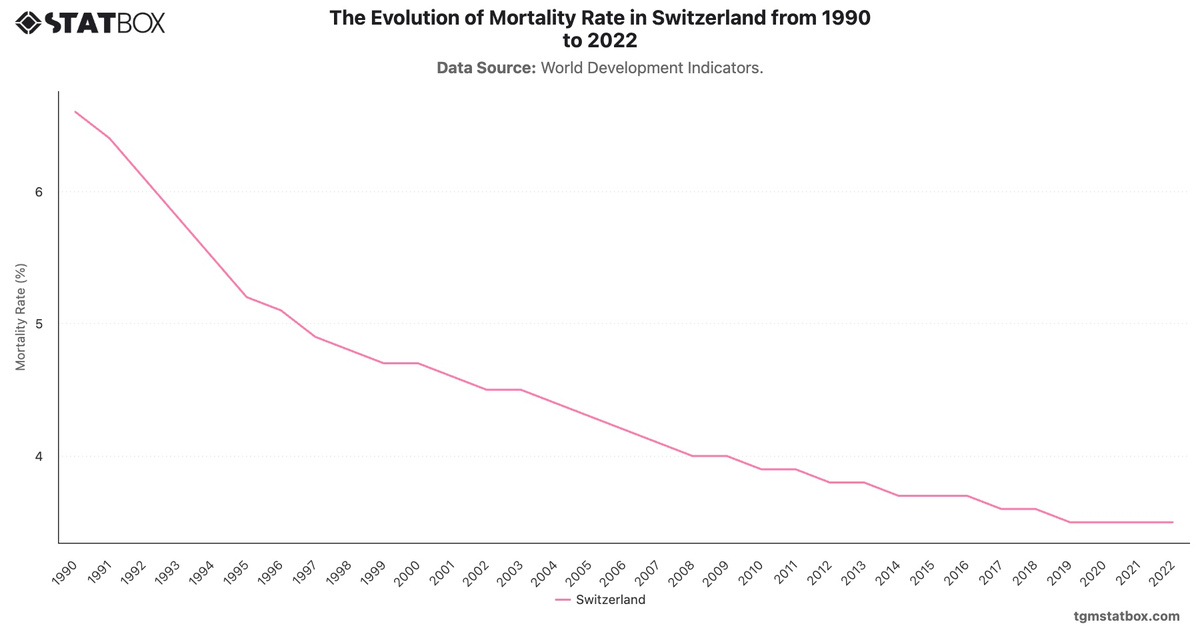
For a broader context, visit other statistics on military personnel share in Switzerland’s population, Switzerland’s mortality rate trends, Switzerland’s mortality rate.