Unemployment Rate Evolution in Ethiopia from 1994 to 2021

Unemployment Rate Evolution in Ethiopia from 1994 to 2021

Share the statistic on social media channels or embed the statistic in your website using "Embed Code", where available.

Share chart

Embed chart
Select Citation

Cite this statistic and select one of the following formats: APA, Chicago, Harvard, MLA & Bluebook


  • APA
  • Chicago
  • Harvard
  • MLA
  • Bluebook
  • IEEE
TGM StatBox. (2024). Unemployment Rate Evolution in Ethiopia from 1994 to 2021. TGM StatBox.
Insights

Key Takeaways

Ethiopia’s unemployment rate has fluctuated moderately since the 1990s, reflecting its agricultural economy and rural-based workforce. The rate remained low, around 3%, until a slight rise to 3.9% in 2021, reflecting urban migration and job market pressures. Ethiopia’s economic focus on infrastructure and industrial parks has created jobs, but rapid population growth and limited job diversity continue to challenge urban employment stability, especially as the economy seeks to transition to industry-based jobs.

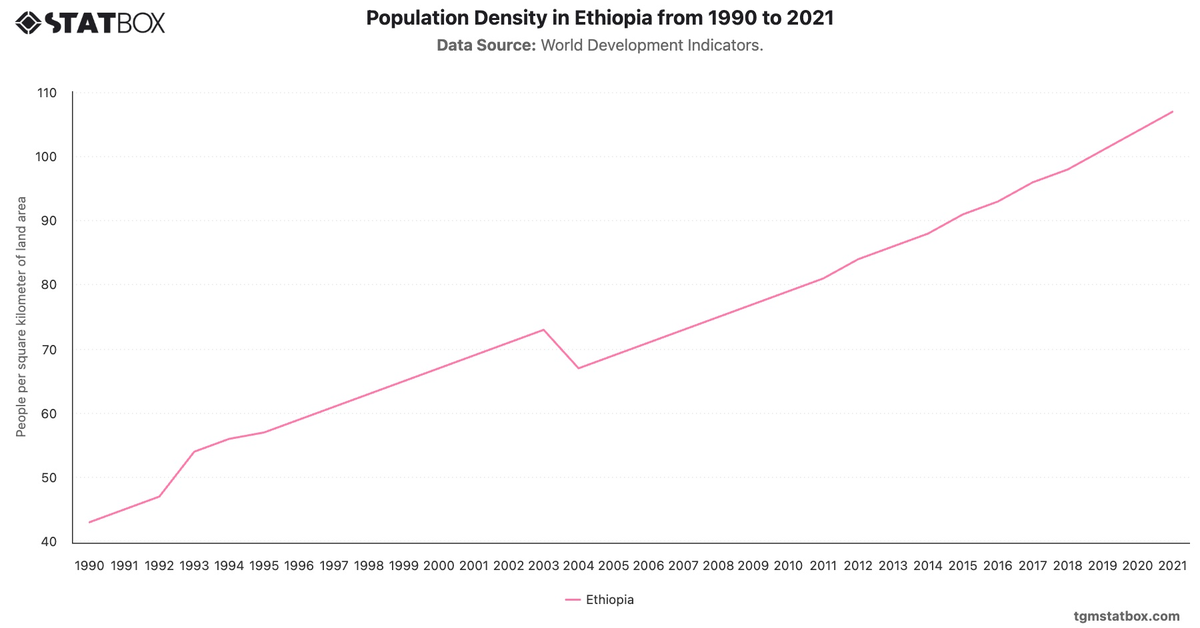
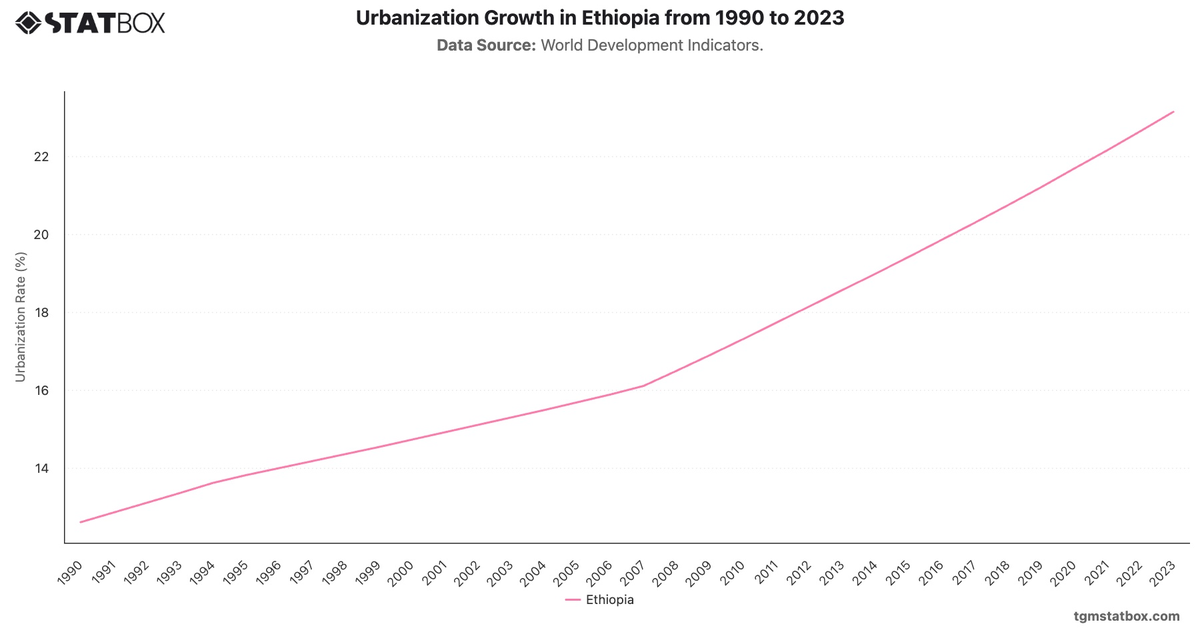
Gain a broader perspective by reviewing Ethiopia’s urban growth, Ethiopia’s population density, Industry sector’s GDP share.

Further Recommended Statistics

Statbox vector
Statbox |form contact icon

Have Other Queries?

Statbox vector

Connect with our expert team for immediate assistance or comprehensive market analysis. We are always ready to support your business needs.