Ethiopia experienced periods of extreme inflation, such as 44.4% in 2008, driven by rising food prices and political instability. Inflation remained elevated, peaking again at 33.9% in 2022, reflecting supply chain disruptions, conflict, and global economic pressures.
Projections indicate a gradual decline to 14.3% by 2026, with inflation stabilizing thereafter. This trend underscores the importance of economic reforms and political stability in curbing inflationary pressures in Ethiopia.
Projections indicate a gradual decline to 14.3% by 2026, with inflation stabilizing thereafter. This trend underscores the importance of economic reforms and political stability in curbing inflationary pressures in Ethiopia.
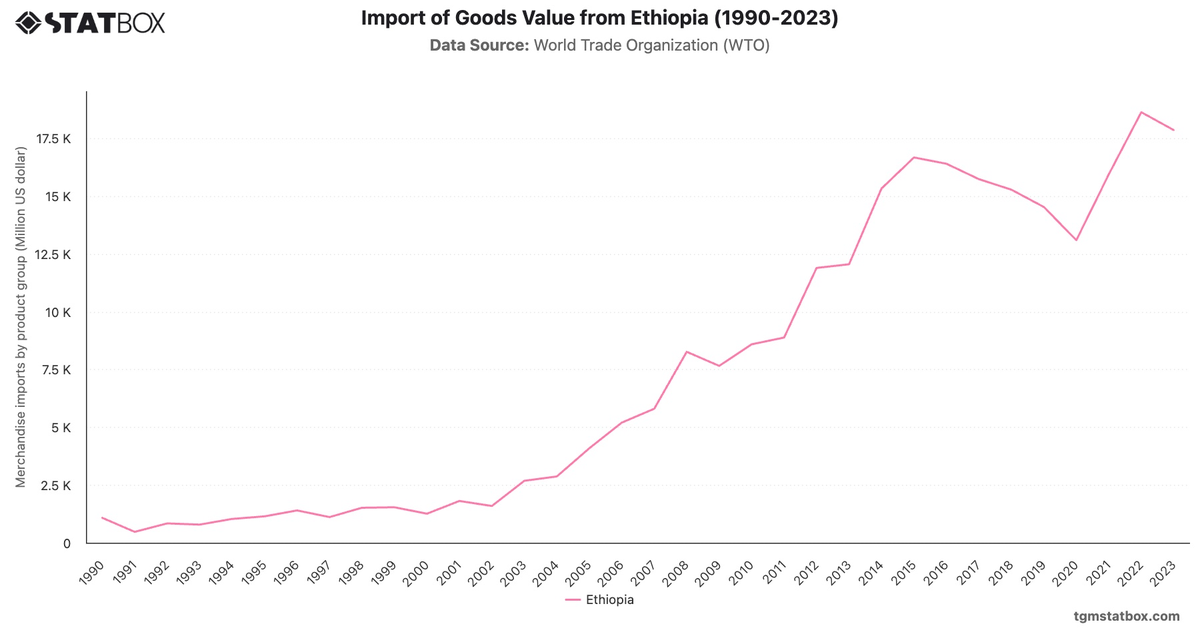
For a deeper dive into the topic, explore Ethiopia’s import value, Ethiopia’s net lending/borrowing, Industry sector’s GDP share.