Ethiopia’s Net ODA (% of GNI) peaked in the early 2000s, reaching 18.9% in 2003, driven by large-scale poverty reduction and humanitarian assistance programs. This surge was largely due to Ethiopia’s strategic partnerships with donors addressing chronic food insecurity and development challenges.
After 2010, ODA steadily declined, stabilizing around 5% by the 2020s. This reflects Ethiopia’s progress in economic growth and infrastructure development, though periodic increases highlight ongoing humanitarian crises, such as droughts and conflict-related displacements.
After 2010, ODA steadily declined, stabilizing around 5% by the 2020s. This reflects Ethiopia’s progress in economic growth and infrastructure development, though periodic increases highlight ongoing humanitarian crises, such as droughts and conflict-related displacements.
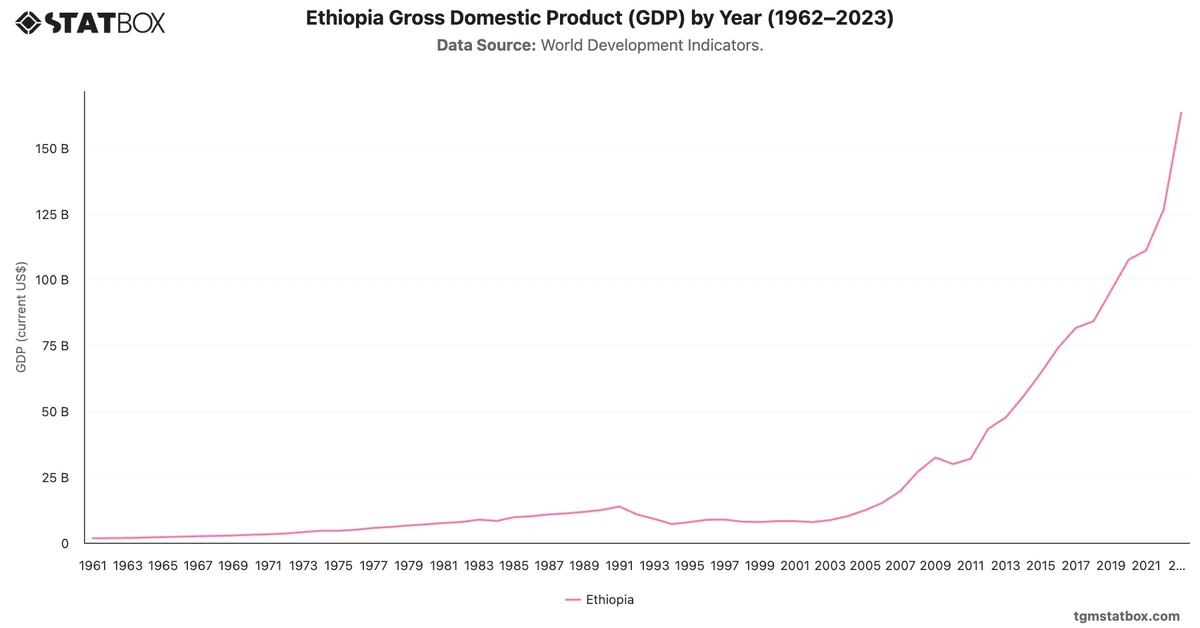
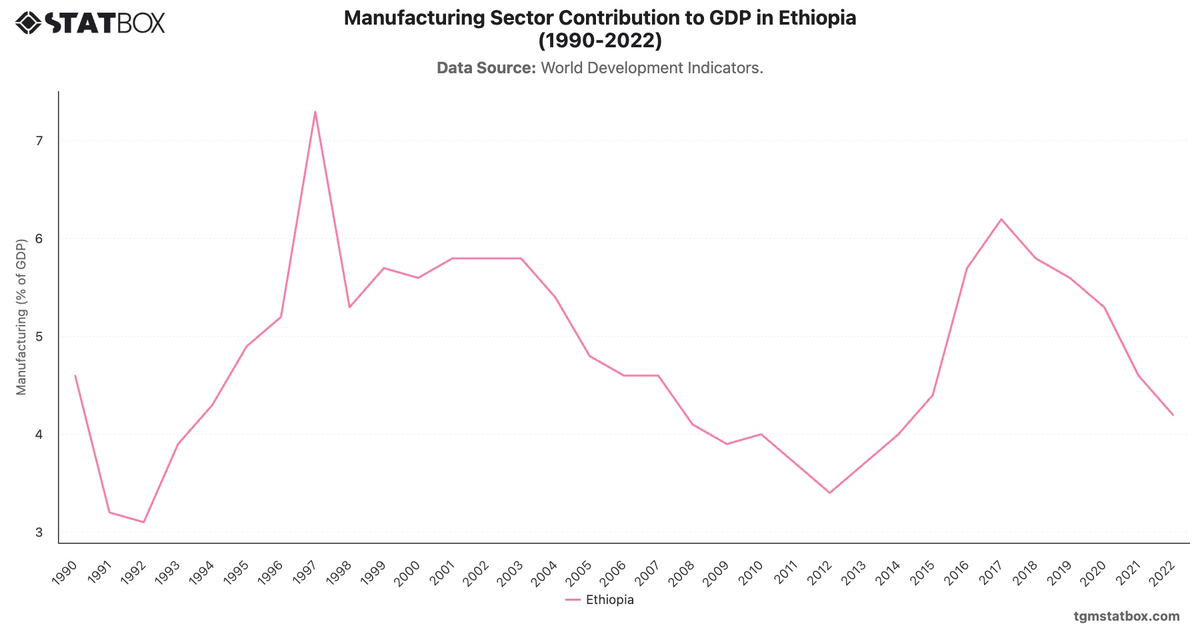
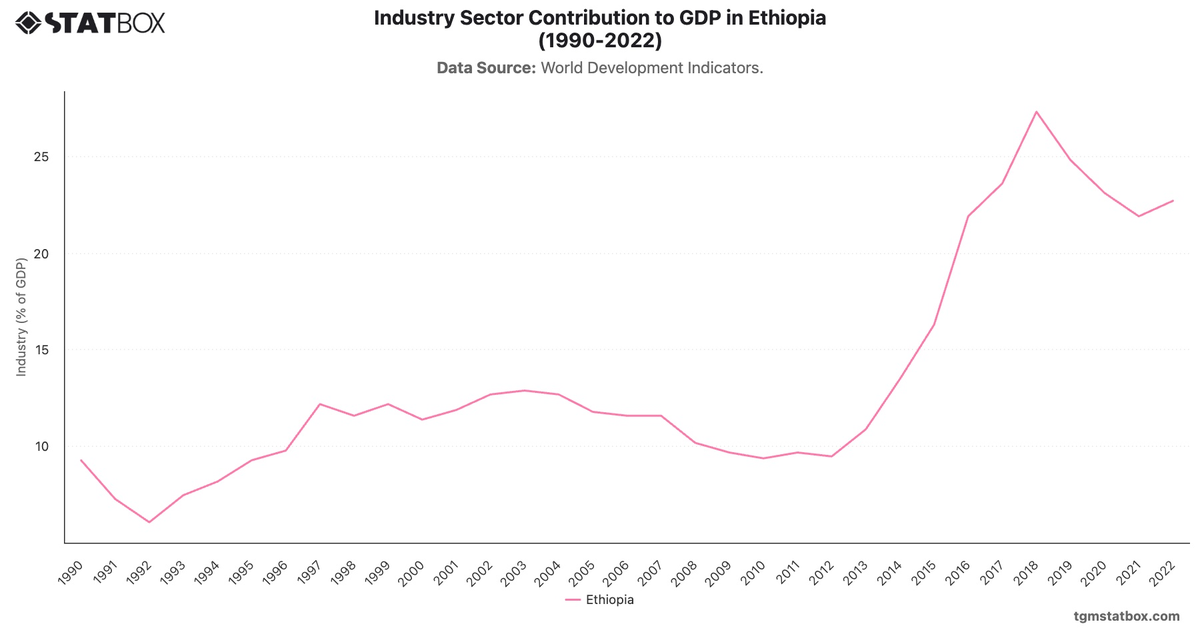
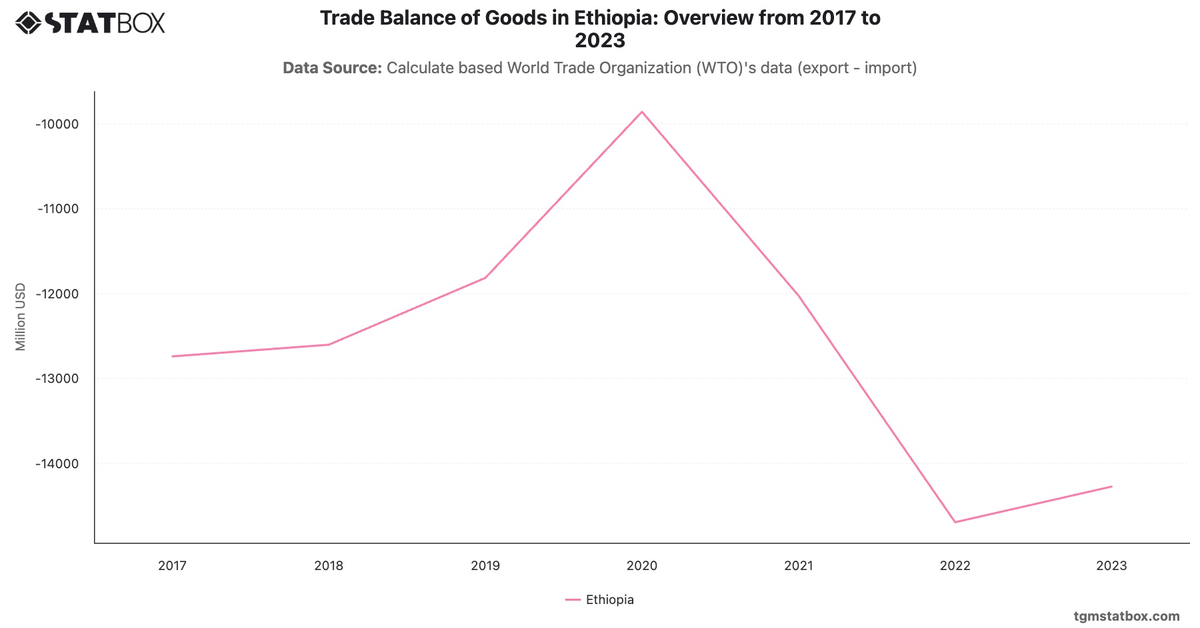
Find out more through related statistics on Ethiopia’s annual GDP figures, Ethiopia’s import value, Industry sector’s GDP share.