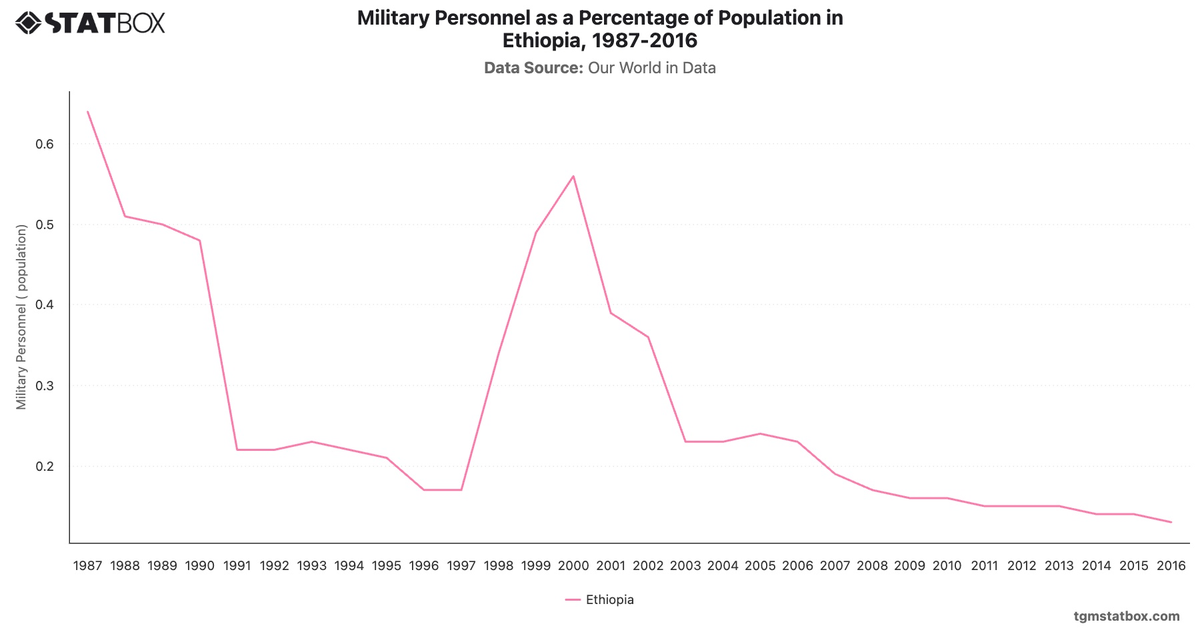
Ethiopia’s military expenditure displayed notable spikes during periods of conflict, peaking at 10.3% of GDP in 1989 amidst the Ethiopian Civil War. Post-1991, spending sharply declined, reaching 3.4% by 1992, as the country focused on rebuilding.
Subsequent decades saw lower military investments, with expenditures stabilizing below 1% by 2015. These reductions reflect Ethiopia's shifting priorities toward economic growth and addressing developmental challenges.
Subsequent decades saw lower military investments, with expenditures stabilizing below 1% by 2015. These reductions reflect Ethiopia's shifting priorities toward economic growth and addressing developmental challenges.
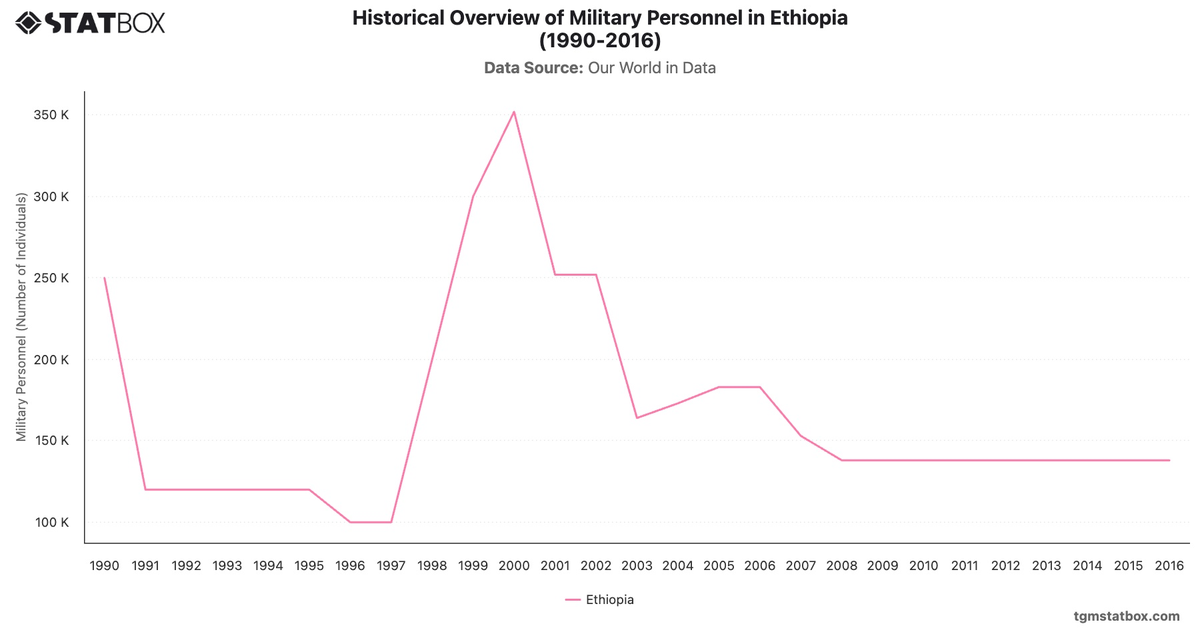
Explore related charts to gain a better understanding of historical military personnel numbers in Ethiopia, Ethiopia’s yearly net ODA received, Ethiopia’s annual GDP figures.