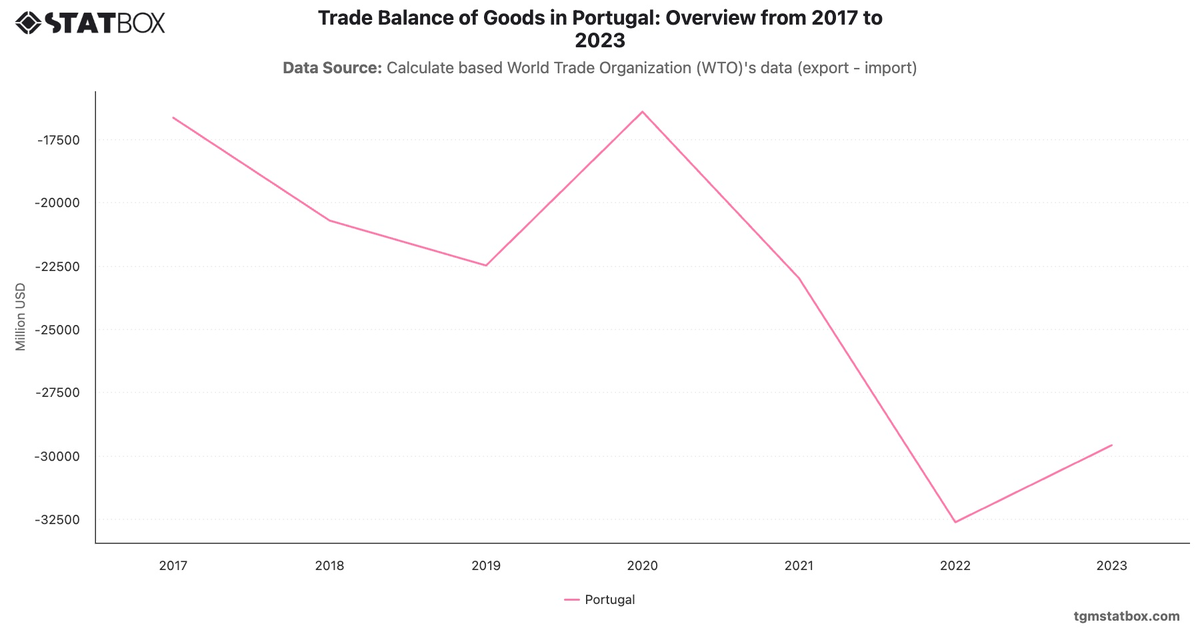
Portugal’s imports rose steadily from $25.3B in 1990 to $115.1B in 2022, reflecting economic modernization and EU integration. The early 2000s saw imports increase from $47.2B in 2003 to $94.4B in 2008, driven by consumer demand and industrial expansion.
After a dip to $71.6B in 2009 during the financial crisis, imports recovered, reaching $115.1B in 2022, supported by growth in tourism and exports. The 2023 figure of $113.4B reflects steady economic activity amidst global uncertainties.
After a dip to $71.6B in 2009 during the financial crisis, imports recovered, reaching $115.1B in 2022, supported by growth in tourism and exports. The 2023 figure of $113.4B reflects steady economic activity amidst global uncertainties.
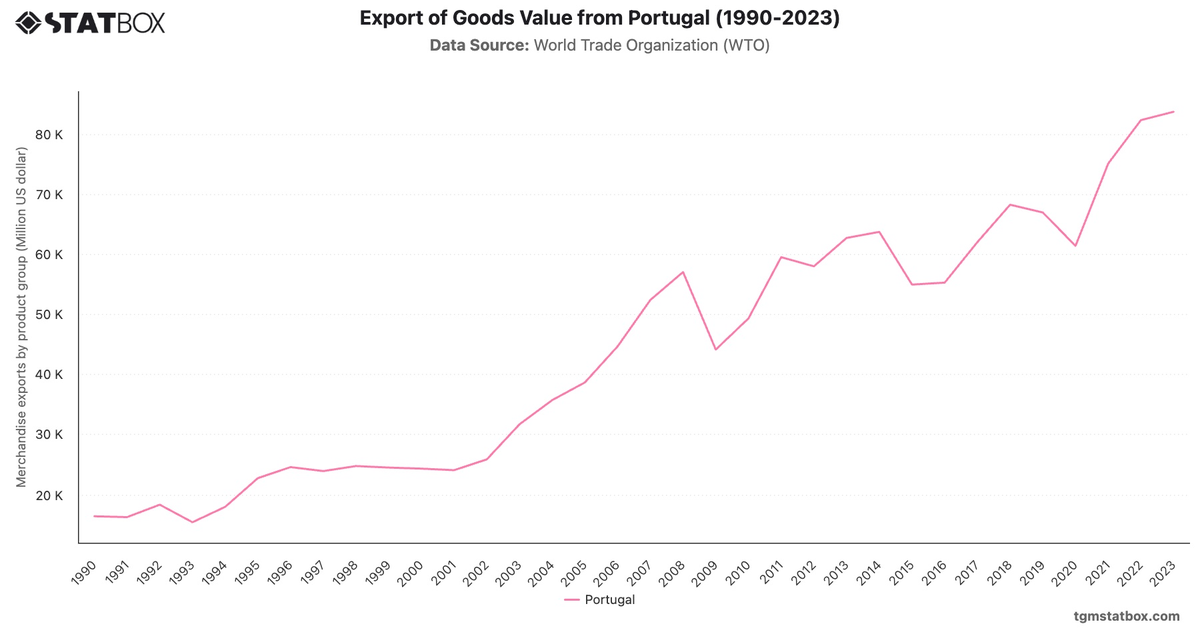
Gain a broader perspective by reviewing Portugal's population numbers, Portugal’s goods export value, urban expansion in Portugal.