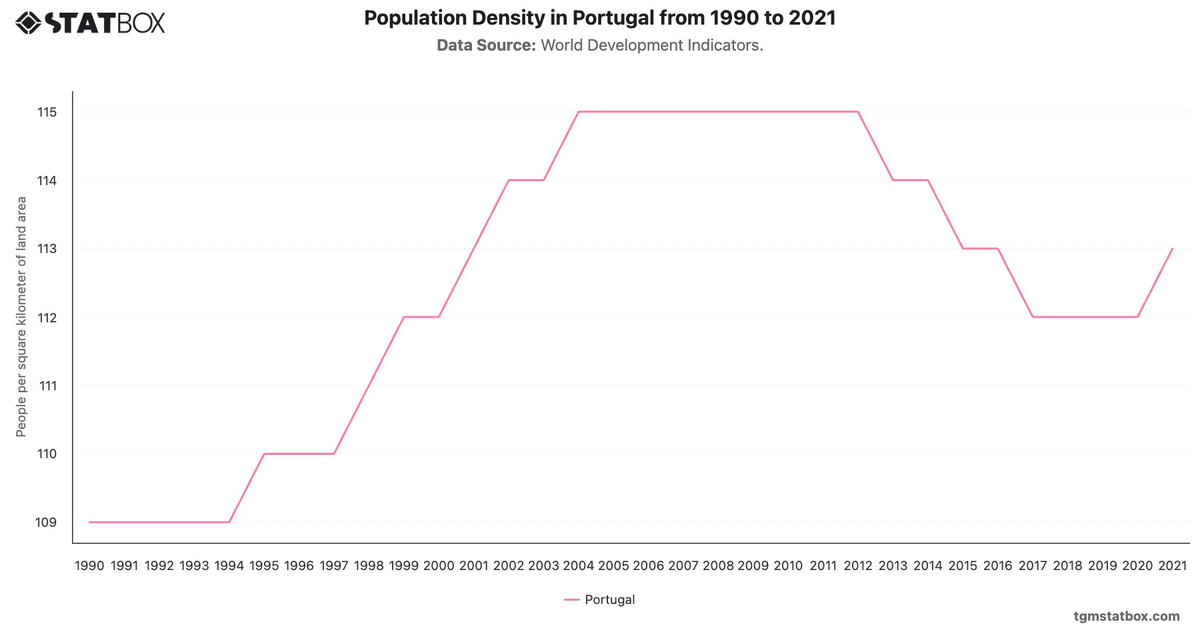
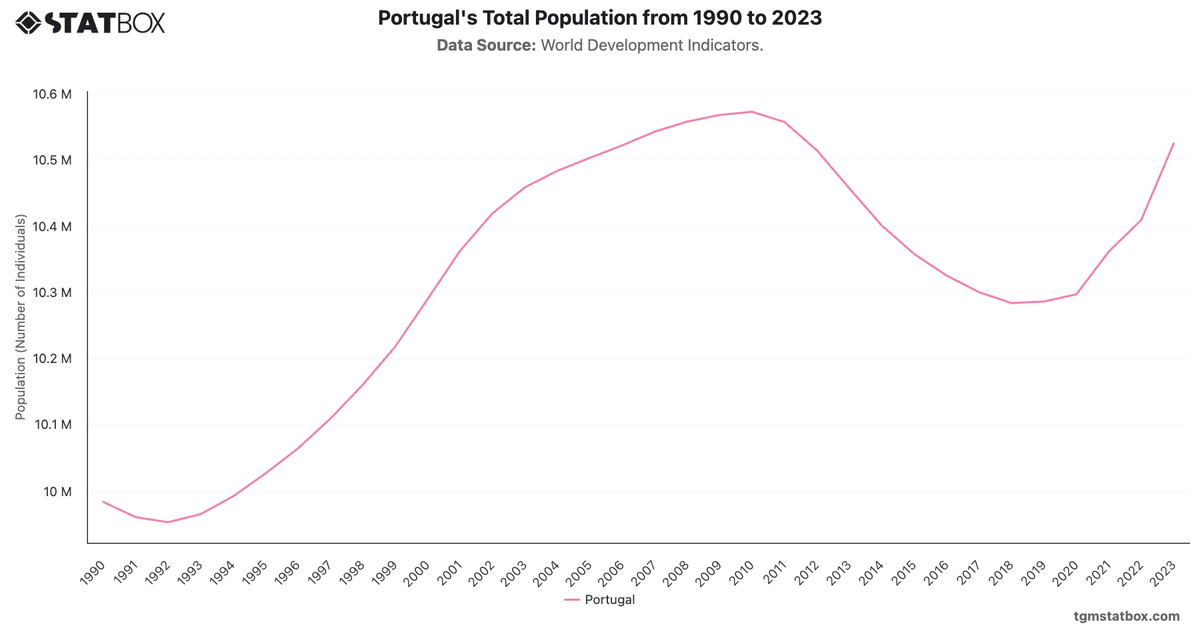
Portugal's population growth demonstrated periods of recovery interspersed with sustained declines. Early growth rates were negative but gradually improved in the 1990s, peaking at 0.7% in 2000. This period of expansion coincided with economic growth, EU membership benefits, and increased immigration. However, from 2011 onward, population decline re-emerged due to economic recession and declining birth rates, with growth dipping to -0.5% by 2013.
A rebound occurred in the 2020s, partly driven by immigration and improved economic conditions. Notably, the population growth rate surged to 1.1% in 2023, marking a significant recovery. Factors such as Portugal’s attractiveness as a destination for expatriates and returning citizens contributed to this positive trend, signaling a reversal of earlier demographic challenges.
A rebound occurred in the 2020s, partly driven by immigration and improved economic conditions. Notably, the population growth rate surged to 1.1% in 2023, marking a significant recovery. Factors such as Portugal’s attractiveness as a destination for expatriates and returning citizens contributed to this positive trend, signaling a reversal of earlier demographic challenges.
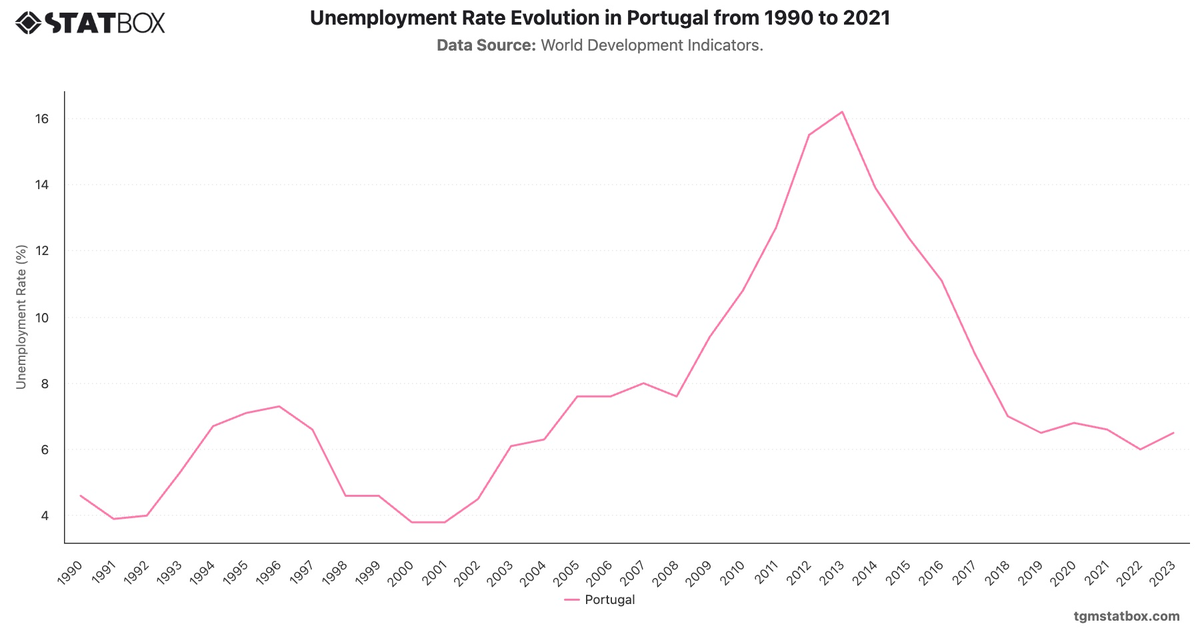
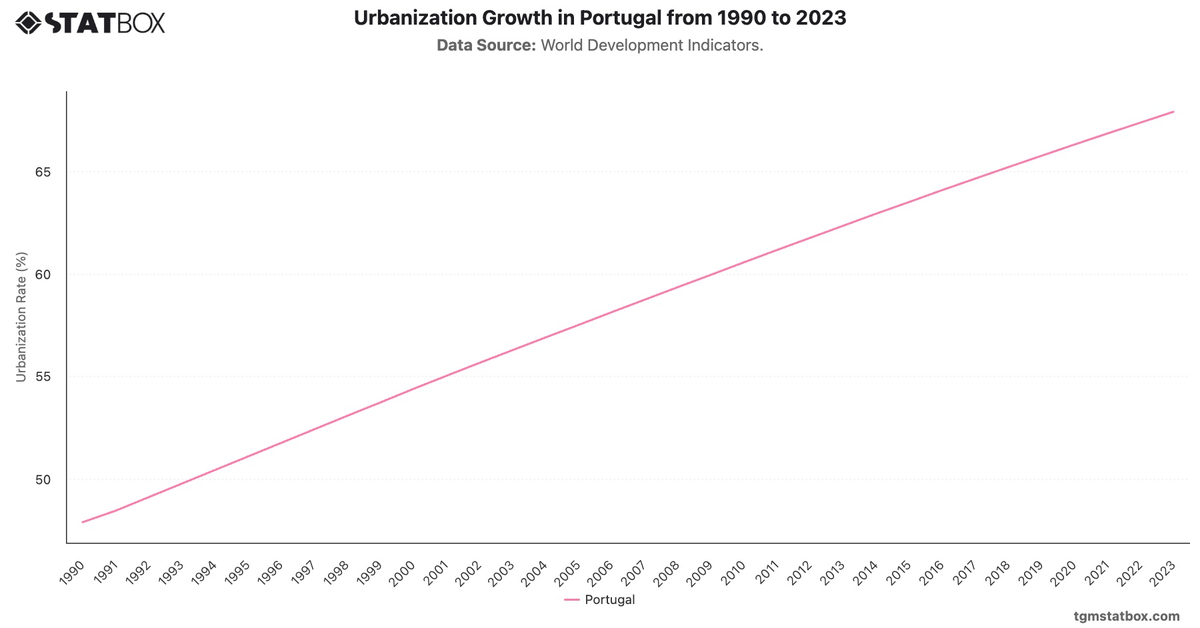
Find out more through related statistics on Portugal’s unemployment rate trend, Portugal’s mortality rate trends, urban expansion in Portugal.