Italy's military expenditure showed distinct trends from 1960 to 2022, reflecting its geopolitical and economic context. During the Cold War, spending hovered around 2.6–3.0% of GDP, peaking at 3.0% in 1966 as NATO strengthened its presence in Europe. The decline to 2.1% by 1970 coincided with détente and Italy’s focus on economic recovery. The 1980s saw modest fluctuations, stabilizing at 1.9–2.0%, supported by the country's NATO commitments despite domestic fiscal pressures.
Post-Cold War, Italy's defense spending steadily decreased, reaching 1.4% in 2013 amid austerity measures and shifting priorities towards welfare and economic reforms. However, a modest rebound to 1.7% by 2020 was driven by modernizing military capabilities and addressing new security challenges, such as regional instability and NATO’s increased emphasis on burden-sharing.
Post-Cold War, Italy's defense spending steadily decreased, reaching 1.4% in 2013 amid austerity measures and shifting priorities towards welfare and economic reforms. However, a modest rebound to 1.7% by 2020 was driven by modernizing military capabilities and addressing new security challenges, such as regional instability and NATO’s increased emphasis on burden-sharing.
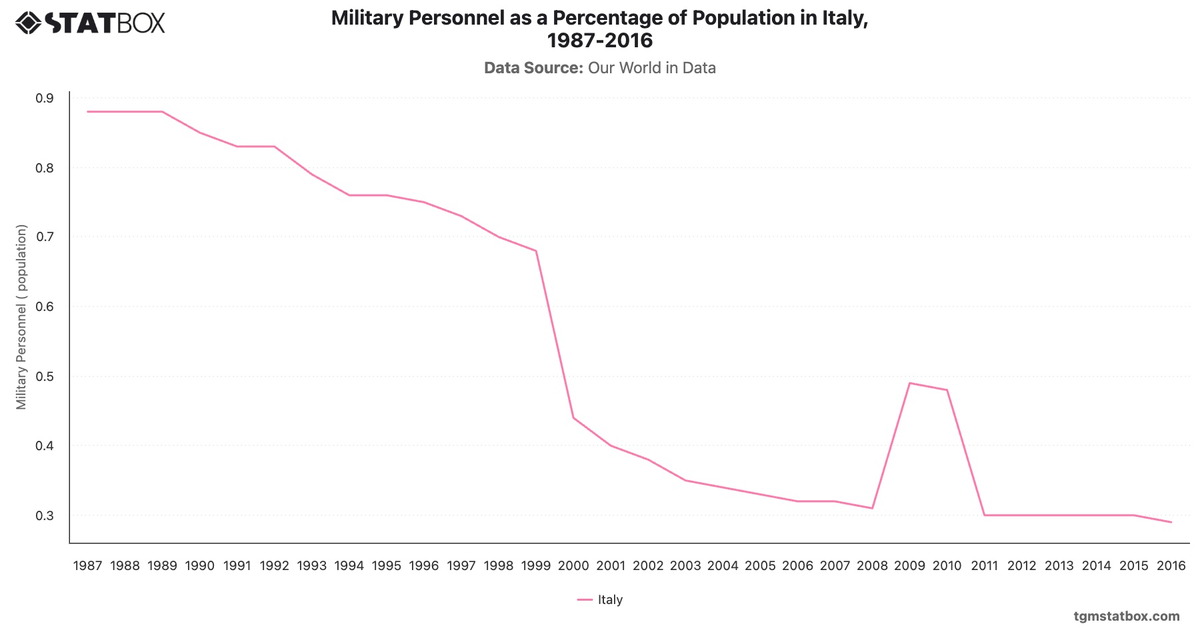
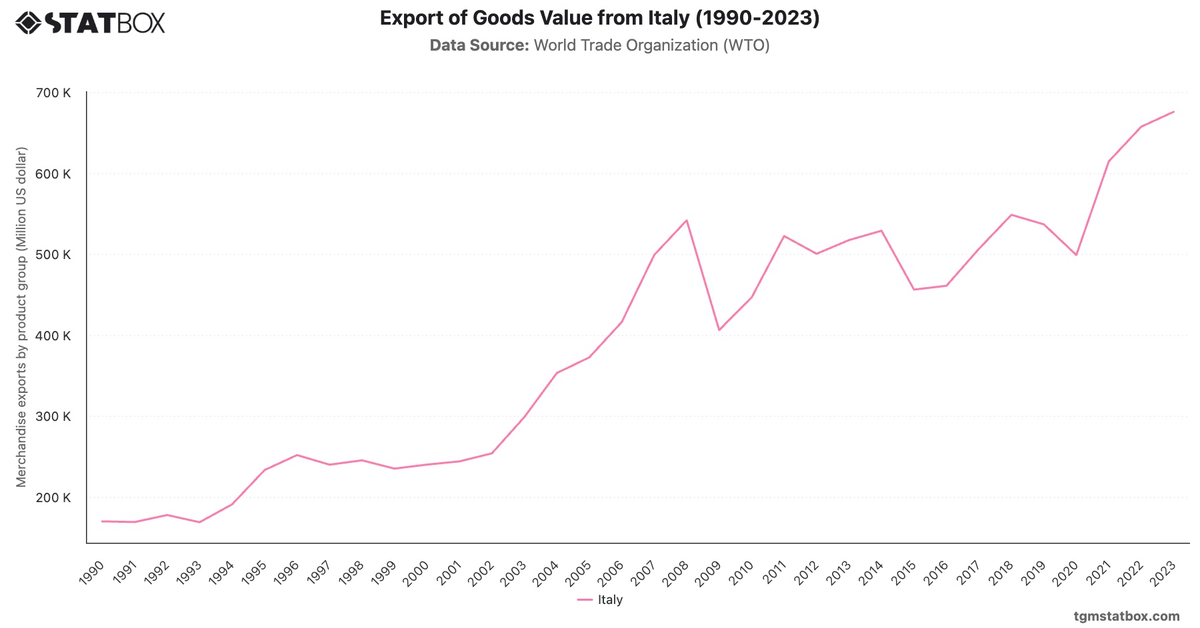
For a deeper dive into the topic, explore Italy’s goods export value, Italy’s military personnel overview, Italy’s changing median age.