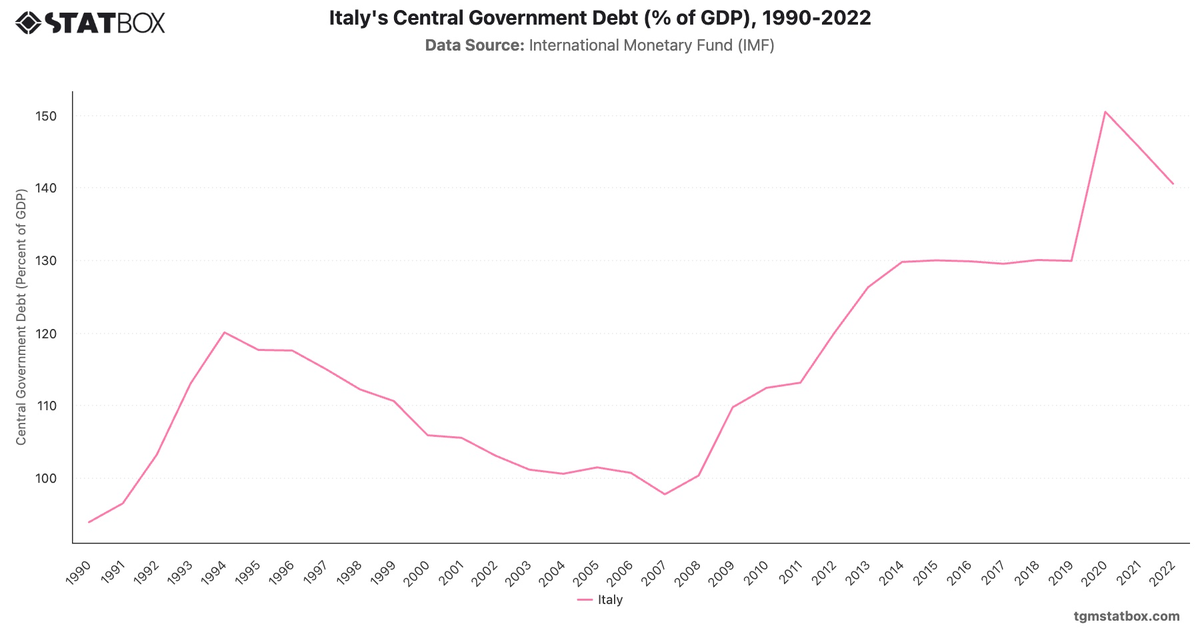
Italy's fiscal trends reflect the challenges of balancing high public debt and economic growth. The 1990s saw deep deficits, peaking at -11.2% in 1990, largely due to structural inefficiencies and high interest payments. The introduction of the euro and EU fiscal rules prompted significant fiscal consolidation, reducing the deficit to -1.8% by 1999.
The 2008 financial crisis and subsequent Eurozone debt crisis widened deficits, with a notable peak at -9.4% in 2020 due to pandemic-related spending. While deficits are projected to stabilize around -3.0% by 2029, Italy's fiscal outlook remains constrained by structural reforms and high debt levels.
The 2008 financial crisis and subsequent Eurozone debt crisis widened deficits, with a notable peak at -9.4% in 2020 due to pandemic-related spending. While deficits are projected to stabilize around -3.0% by 2029, Italy's fiscal outlook remains constrained by structural reforms and high debt levels.
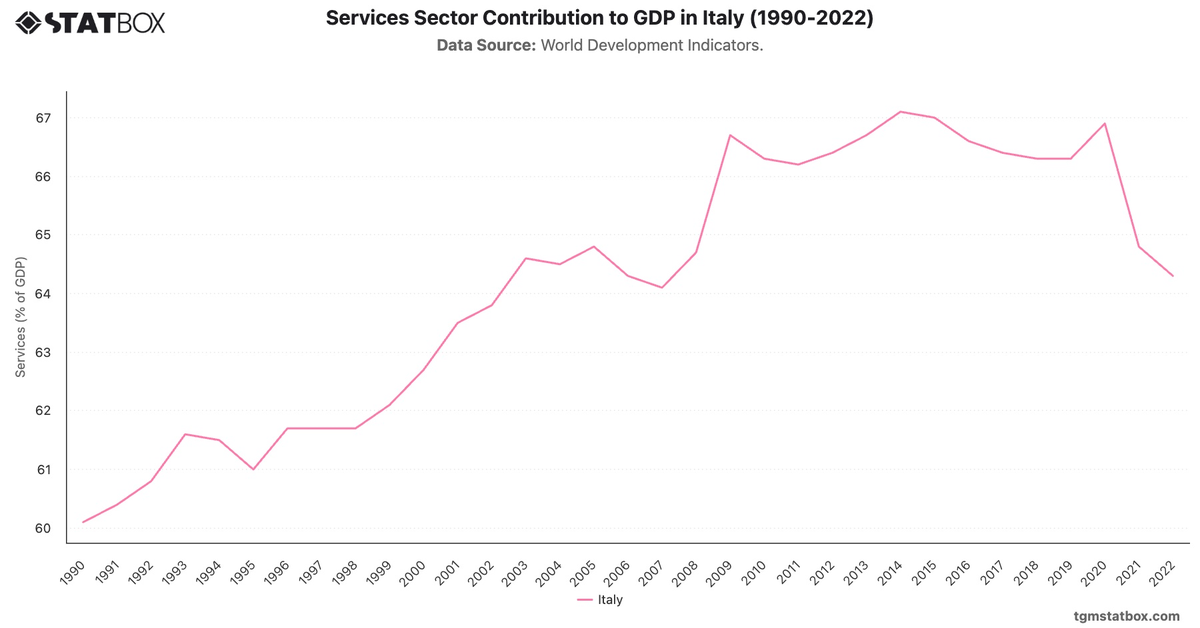
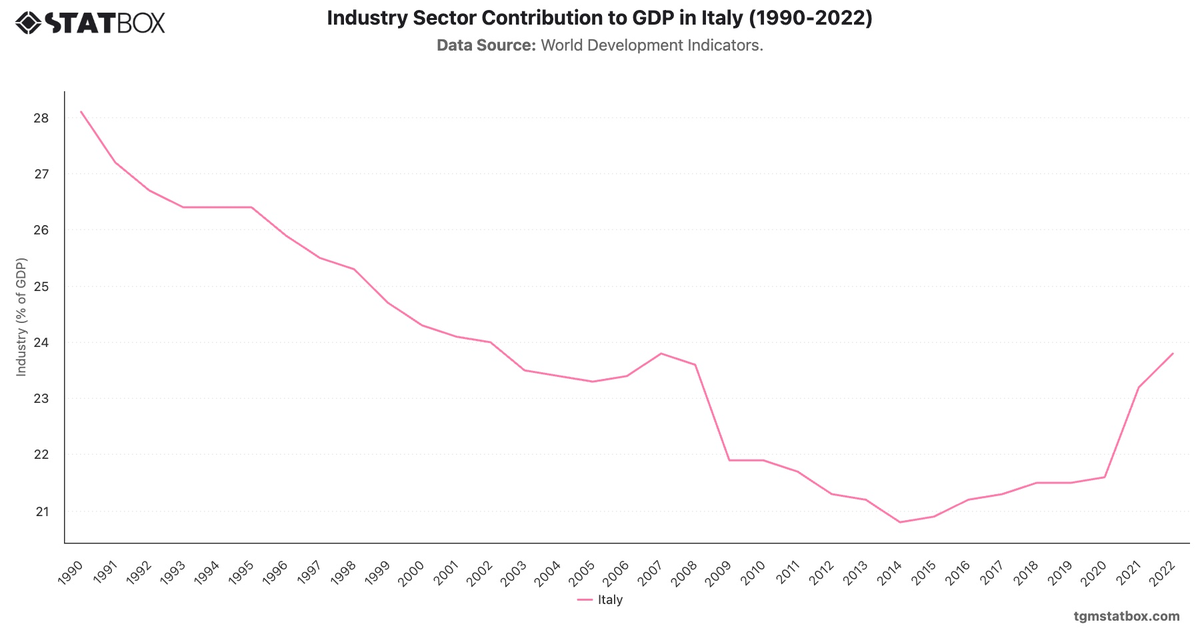
Find out more through related statistics on Italy’s government debt ratio, Italy’s services sector share in GDP, Italy’s industry sector share in GDP.