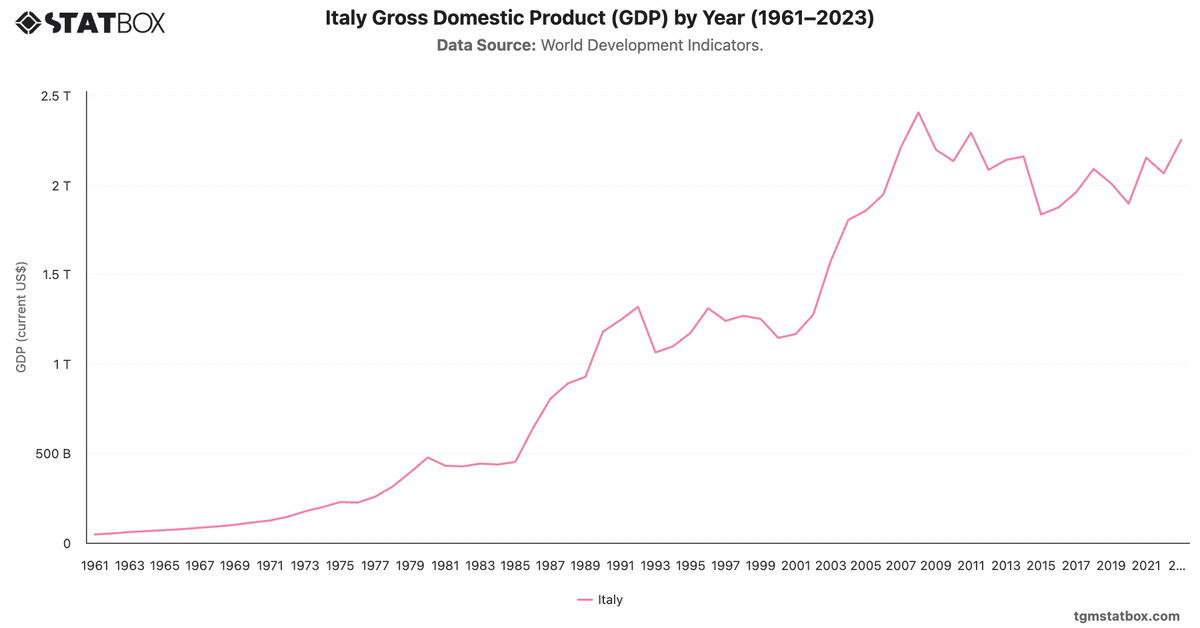
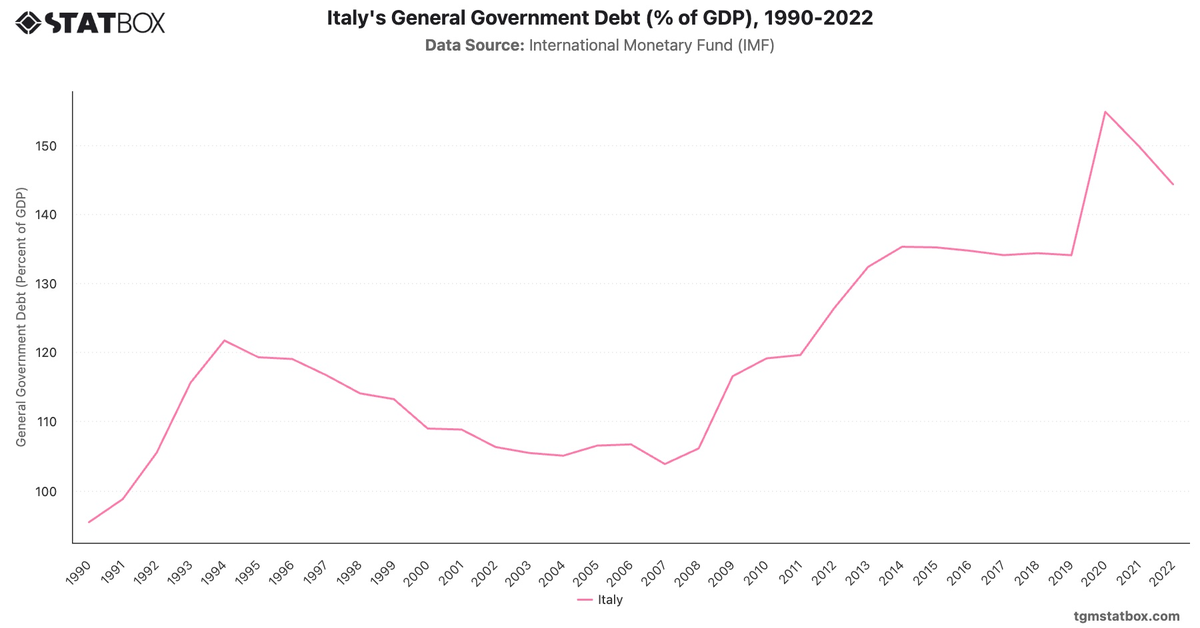
Italy’s debt levels remained persistently high, starting at 93.98% of GDP in 1990 and peaking at 150.49% in 2020. The increase was driven by structural fiscal imbalances and slow economic growth. The Eurozone crisis further exacerbated the debt burden in the early 2010s.
Despite challenges, fiscal consolidation efforts and economic reforms have led to gradual declines, with debt falling to 140.57% by 2022, signaling modest progress in debt sustainability.
Despite challenges, fiscal consolidation efforts and economic reforms have led to gradual declines, with debt falling to 140.57% by 2022, signaling modest progress in debt sustainability.
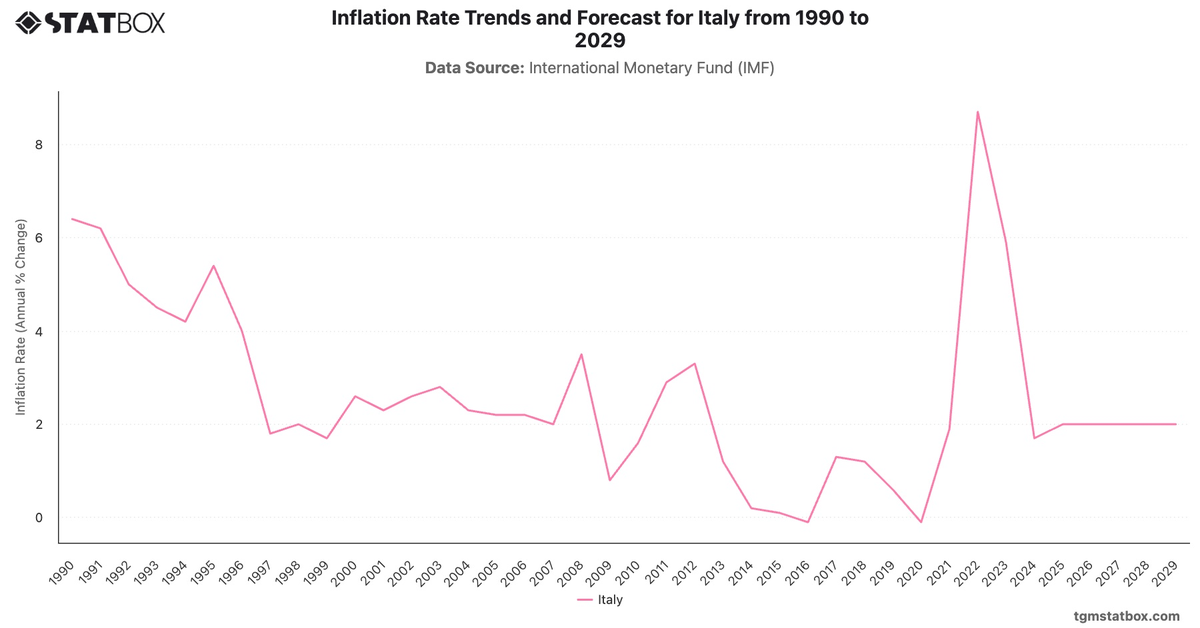
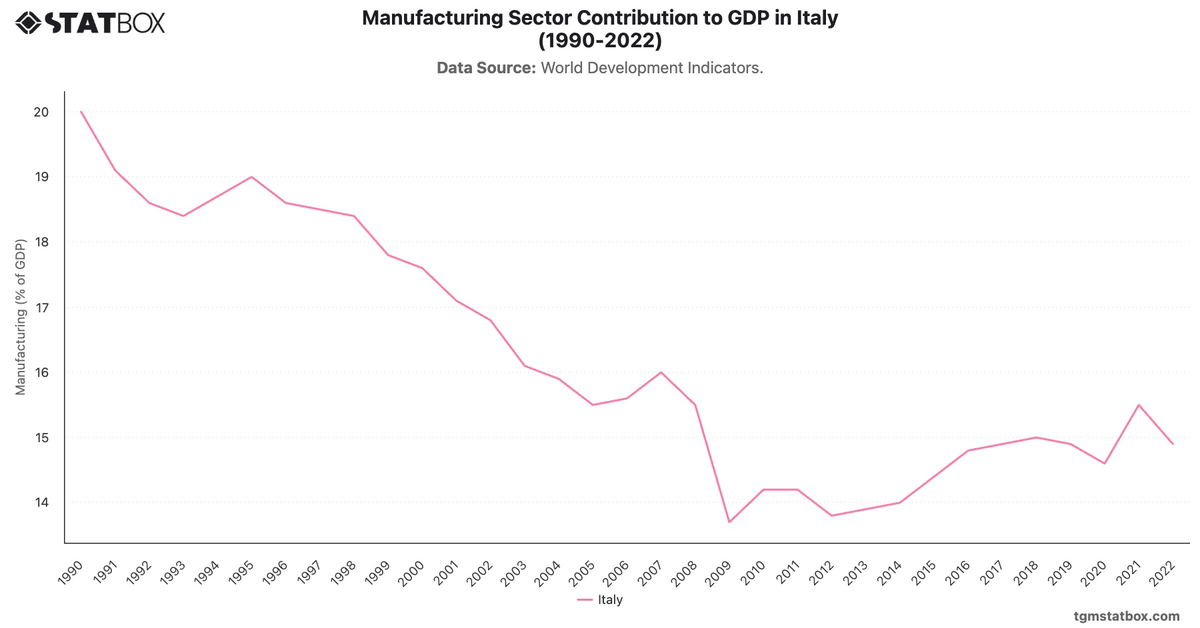
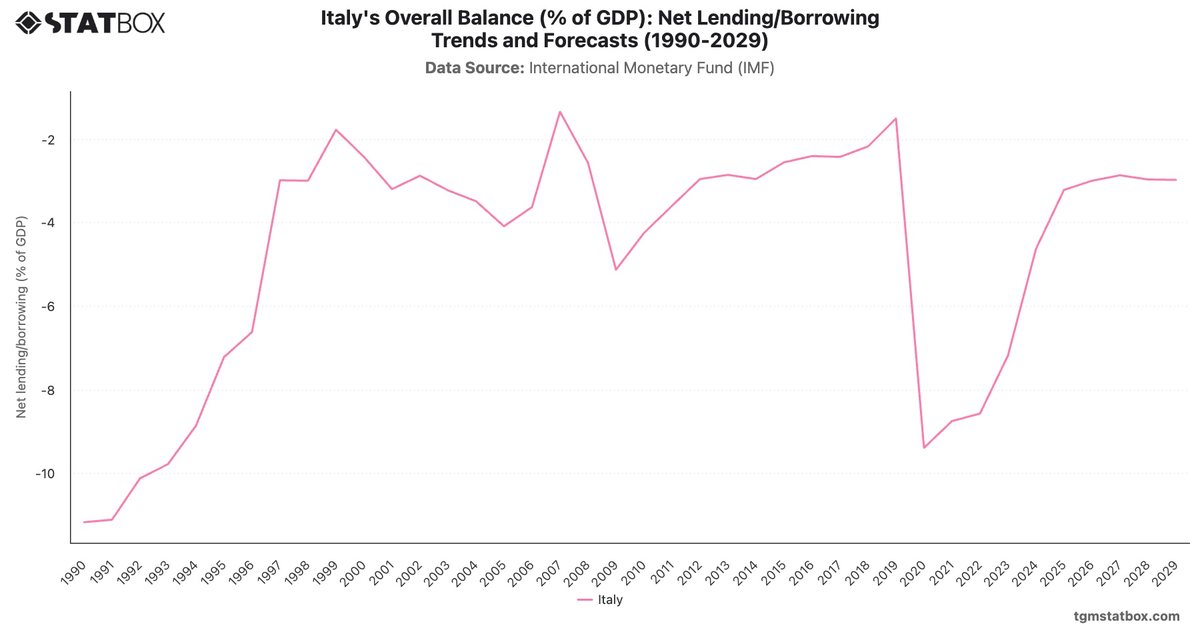
Discover additional trends and data on Italy’s inflation trajectory, Italy’s manufacturing share in GDP, Italy’s net lending/borrowing as share of GDP.