Italy’s unemployment rate fluctuated widely from the 1990s onwards, influenced by economic cycles, labor policies, and external economic pressures. Starting at 9.8% in 1990, it rose to a high of 12.1% by 1998, reflecting structural economic issues and slower-than-expected growth. Entering the 2000s, Italy saw a steady decline in unemployment, hitting a low of 6.1% in 2007 as economic conditions improved.
However, the Eurozone crisis and subsequent economic downturn saw unemployment climb sharply again, reaching 12.7% in 2014. Since then, there has been a gradual decline, falling to 7.7% in 2023, indicative of Italy’s efforts to reform labor laws and improve workforce adaptability. Yet, structural challenges remain, especially in integrating young and southern Italian workers into the labor market.
However, the Eurozone crisis and subsequent economic downturn saw unemployment climb sharply again, reaching 12.7% in 2014. Since then, there has been a gradual decline, falling to 7.7% in 2023, indicative of Italy’s efforts to reform labor laws and improve workforce adaptability. Yet, structural challenges remain, especially in integrating young and southern Italian workers into the labor market.
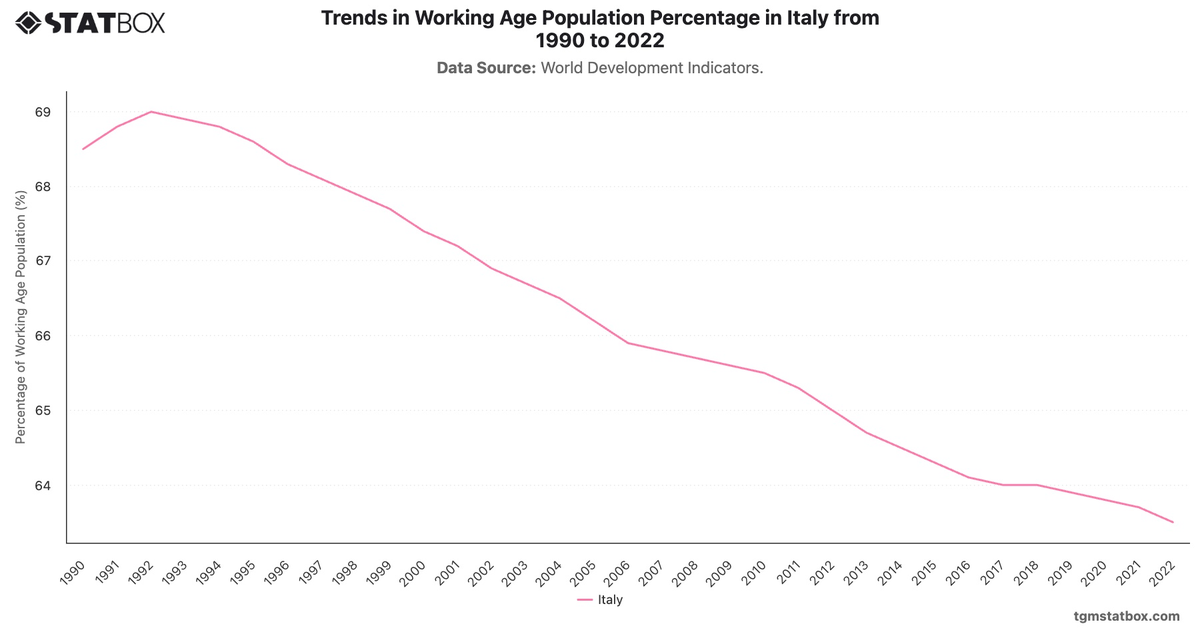
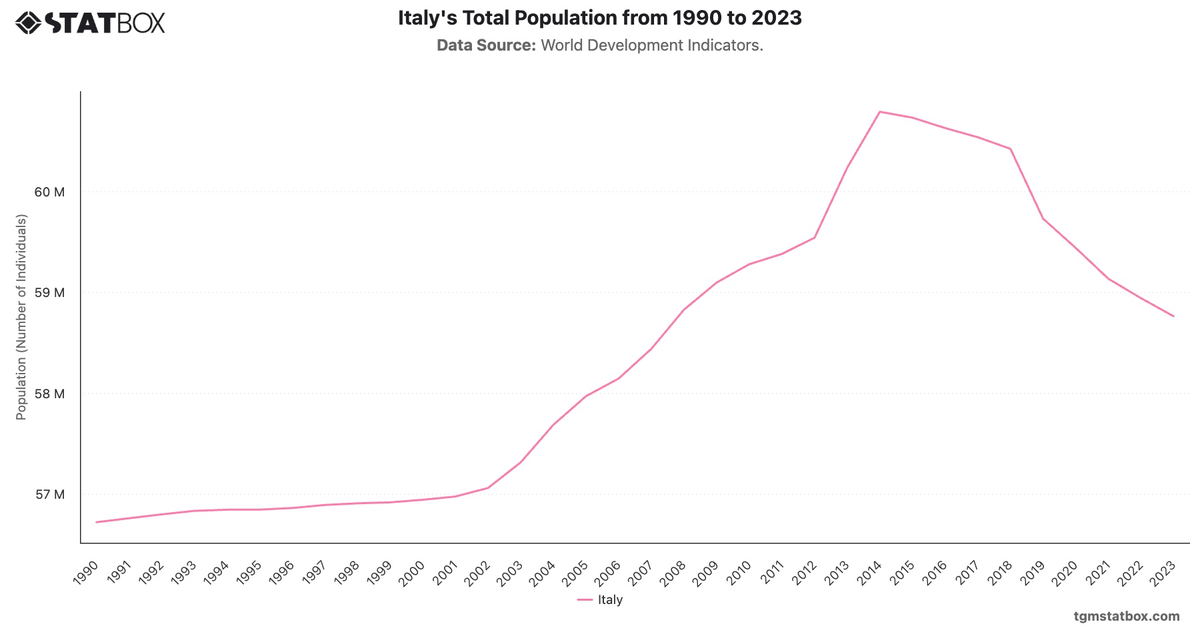
Explore related charts to gain a better understanding of rise in Italy’s urbanization, Italy’s population figures, Italy’s working-age population share.