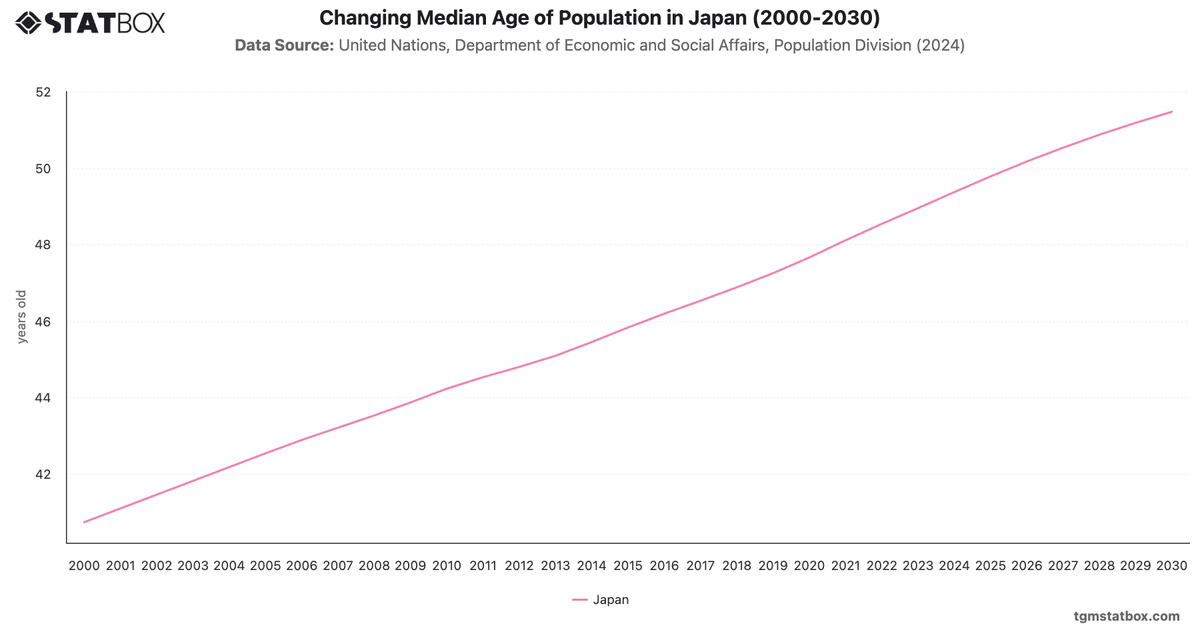
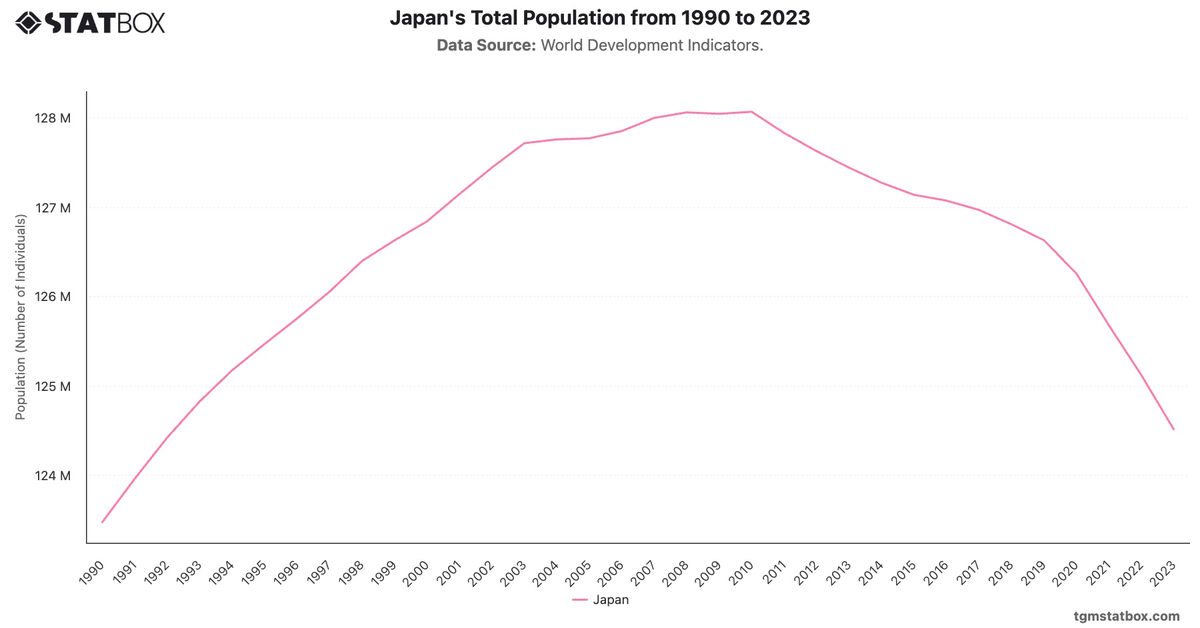
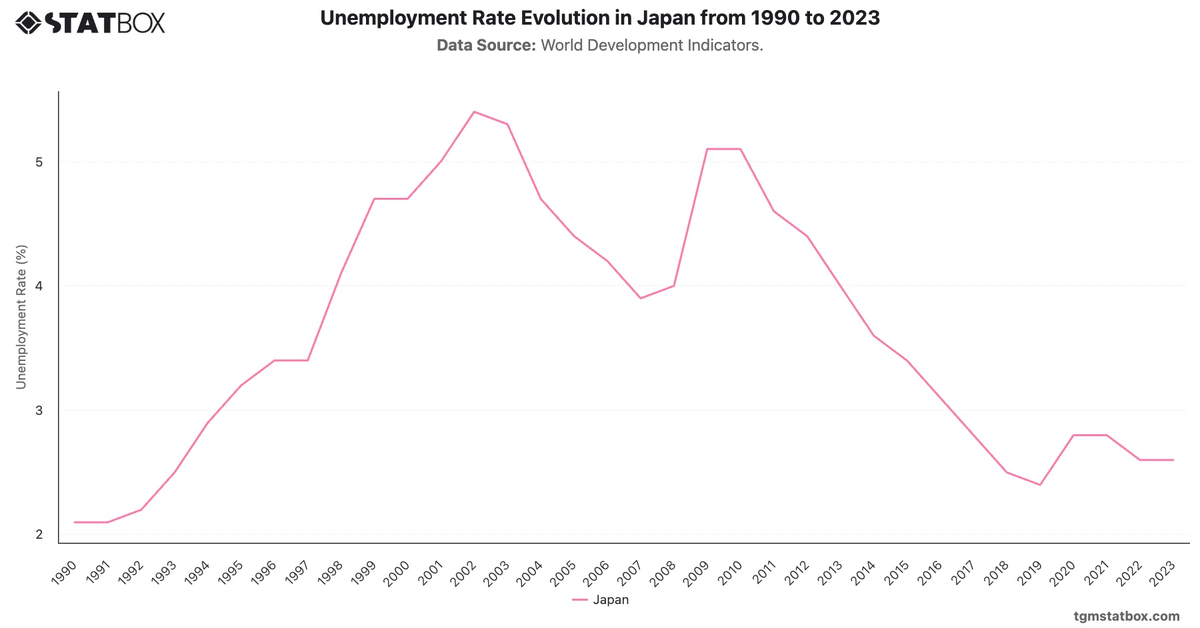
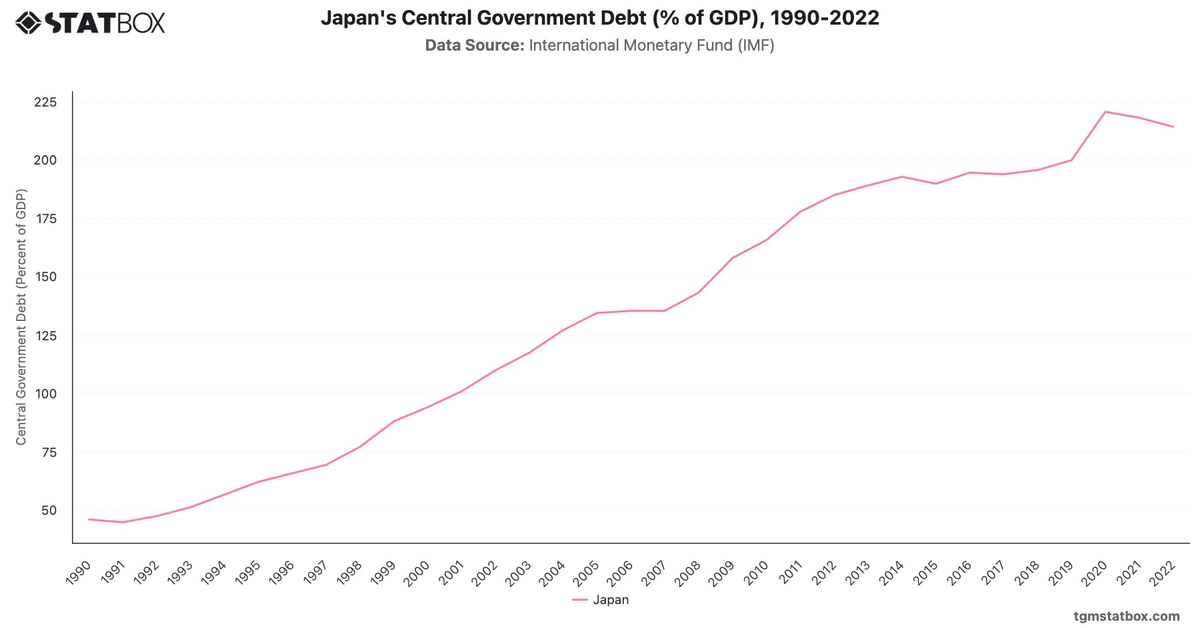
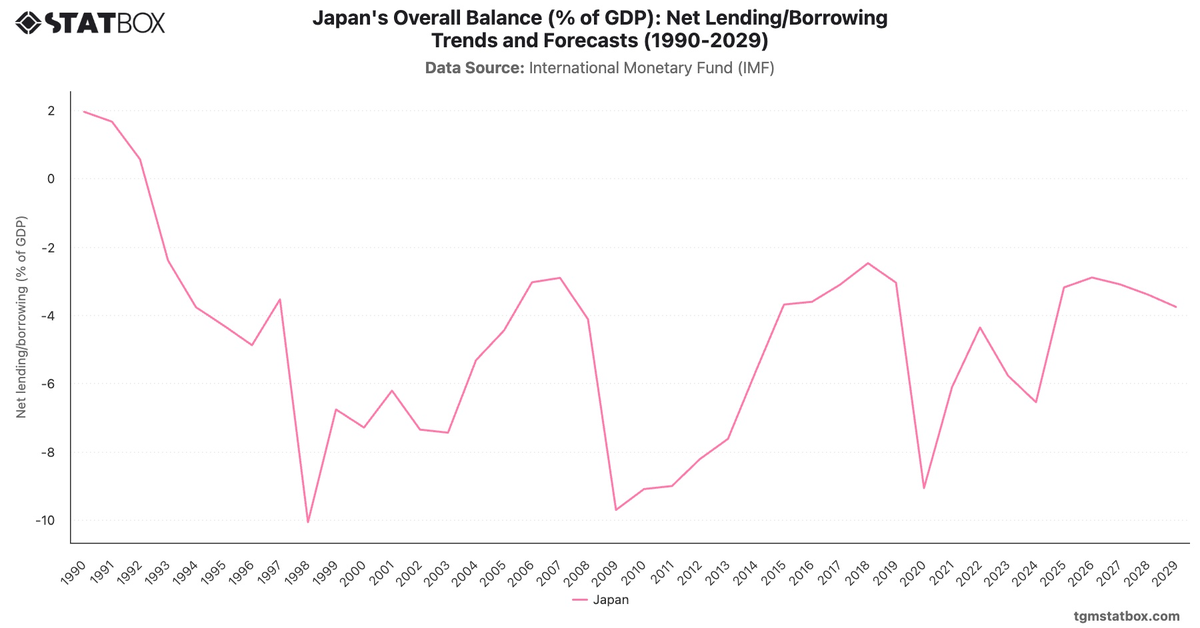
Japan's debt-to-GDP ratio has been on a steep upward trajectory since the 1990s, rising from 63.0% in 1990 to over 200% by 2010. This growth reflects years of slow economic growth, aging demographics, and high social security spending. Major natural disasters, including the 2011 Tohoku earthquake, also contributed to increased government spending, pushing the debt to 219.2% in 2011 and further.
Despite various fiscal strategies, Japan's debt continued to rise, reaching 261.3% in 2022, among the highest globally. Japan's debt burden reflects its reliance on domestic borrowing and low-interest rates, which have enabled it to manage this level without immediate risk. However, long-term challenges remain, particularly with ongoing economic stagnation and increasing social costs due to its aging population.
Despite various fiscal strategies, Japan's debt continued to rise, reaching 261.3% in 2022, among the highest globally. Japan's debt burden reflects its reliance on domestic borrowing and low-interest rates, which have enabled it to manage this level without immediate risk. However, long-term challenges remain, particularly with ongoing economic stagnation and increasing social costs due to its aging population.
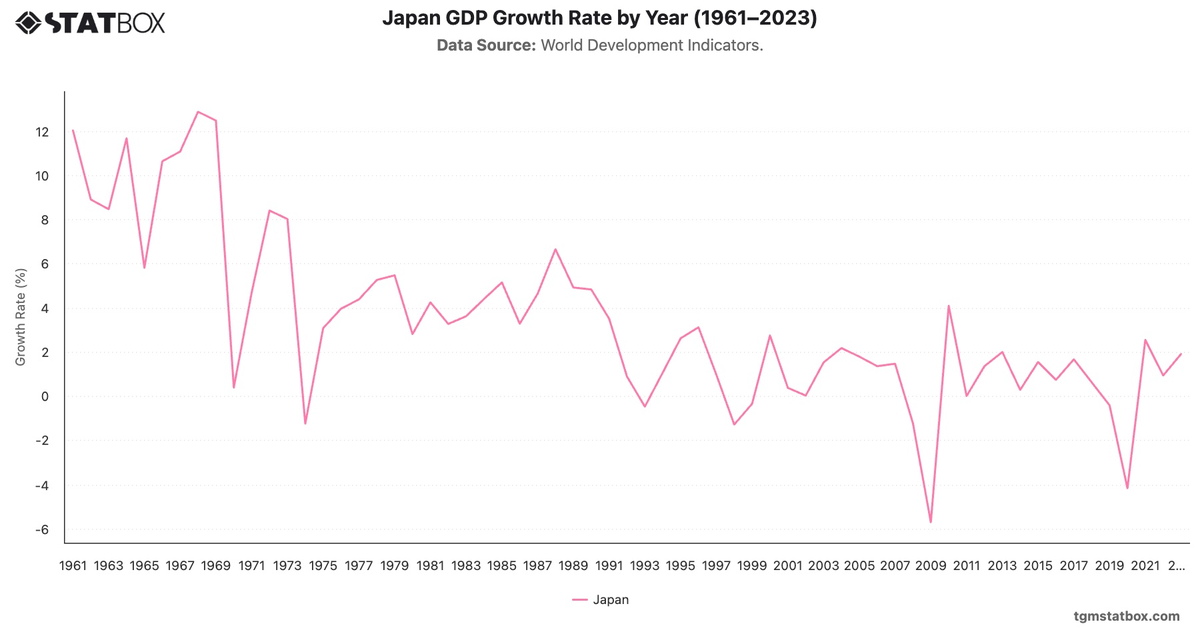
Explore related charts to gain a better understanding of Japan’s annual GDP growth rate, Japan’s birth life span, Japan’s population density estimate.