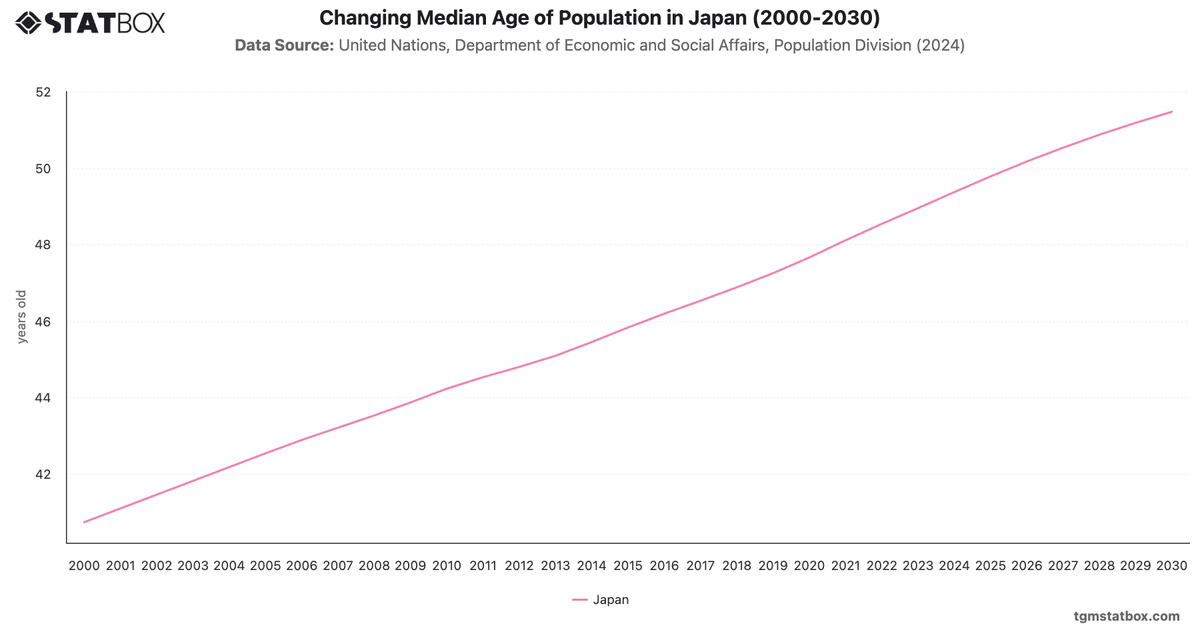
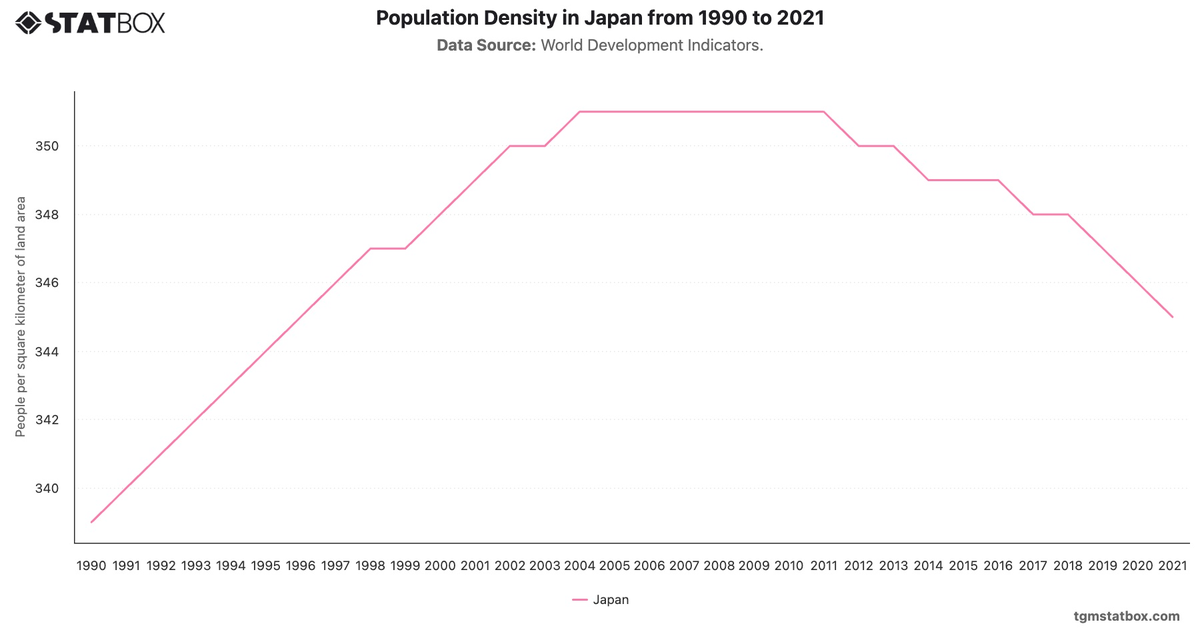
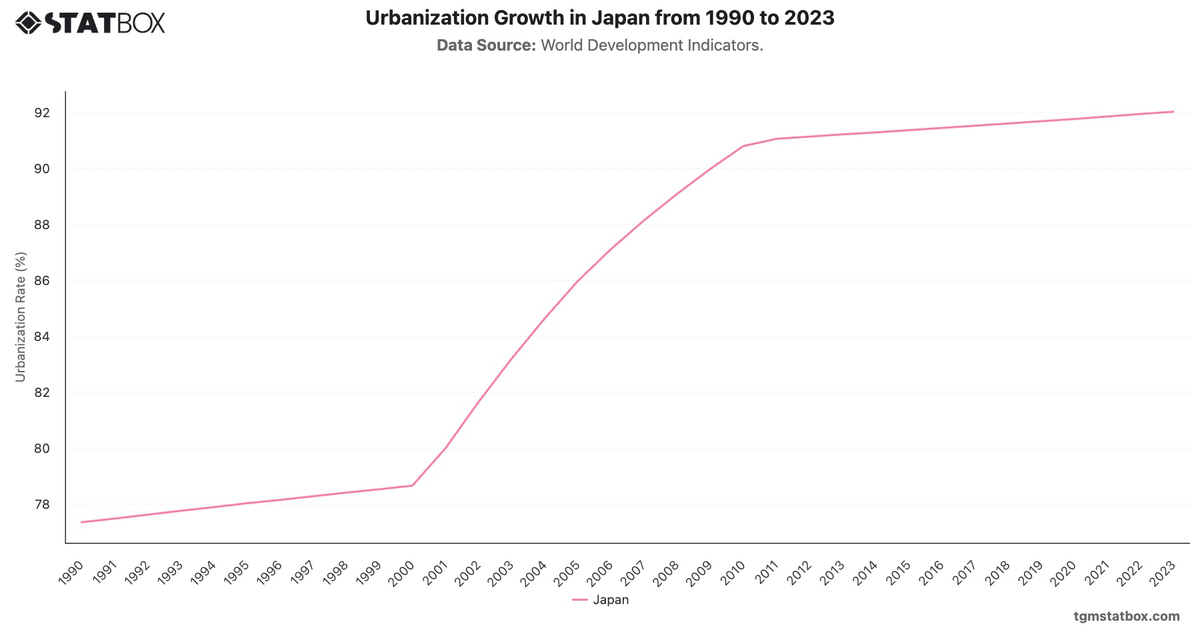
Japan's government debt showed a steep upward trajectory, rising from 46.11% of GDP in 1990 to 135.43% in 2006, driven by aging demographics, economic stagnation, and stimulus spending. Post-2008, the debt surpassed 200%, reaching 263.9% in 2020 as the government addressed pandemic-related economic impacts.
Despite its high debt-to-GDP ratio, Japan maintains low borrowing costs due to strong domestic financing and the Bank of Japan's monetary policies, keeping fiscal pressures manageable.
Despite its high debt-to-GDP ratio, Japan maintains low borrowing costs due to strong domestic financing and the Bank of Japan's monetary policies, keeping fiscal pressures manageable.
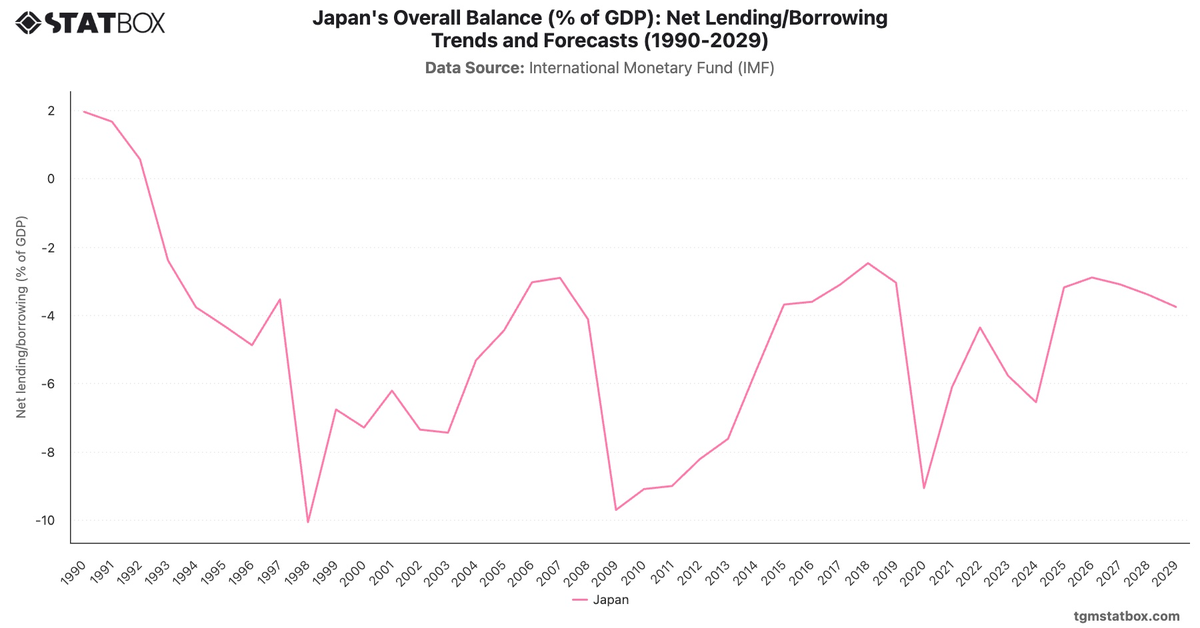
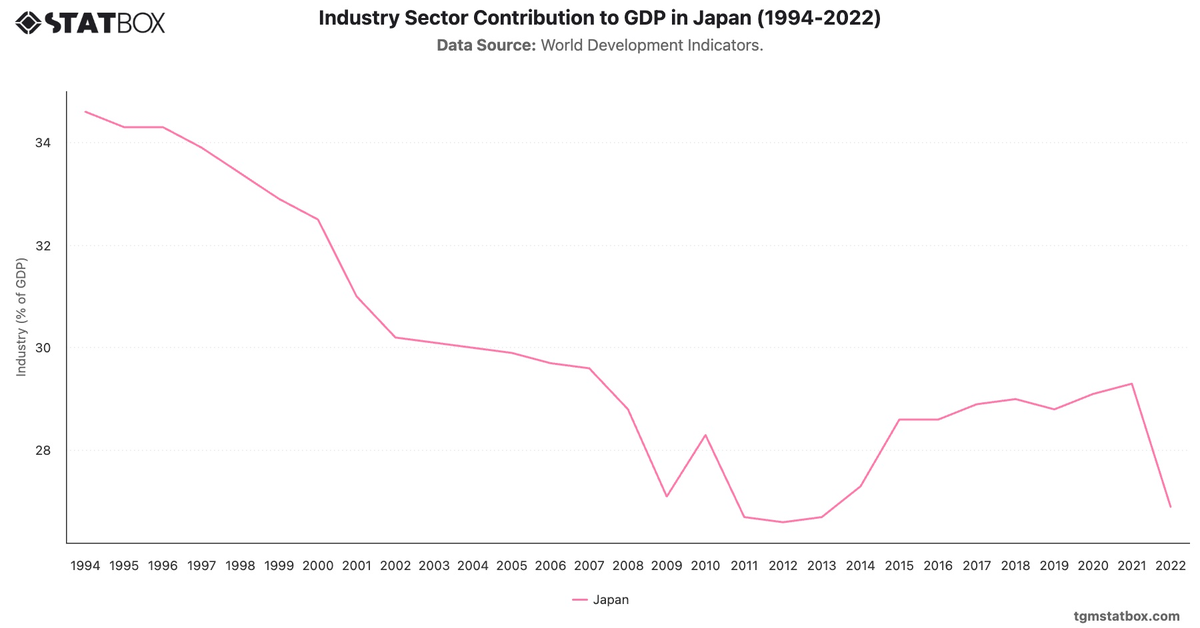
For a deeper dive into the topic, explore Japan’s public debt as percentage of GDP, Japan’s net lending/borrowing as a percentage of GDP, Japan’s industry sector GDP share.