Croatia’s inflation history is marked by a period of hyperinflation in 1993, peaking at 1518.5%, as the country transitioned from a socialist to a market-based economy amidst the dissolution of Yugoslavia. However, by 1995, inflation dramatically declined to 2.0%, thanks to monetary stabilization measures and fiscal reforms. Inflation remained relatively low and stable through the 2000s, except for a spike to 5.8% in 2008 during the global financial crisis.
In 2022, inflation rose sharply to 10.7%, driven by rising energy costs and supply chain challenges. Projections suggest a decline to 2.2% by 2026, reflecting Croatia's strong economic recovery and integration into the European Union's economic framework.
In 2022, inflation rose sharply to 10.7%, driven by rising energy costs and supply chain challenges. Projections suggest a decline to 2.2% by 2026, reflecting Croatia's strong economic recovery and integration into the European Union's economic framework.
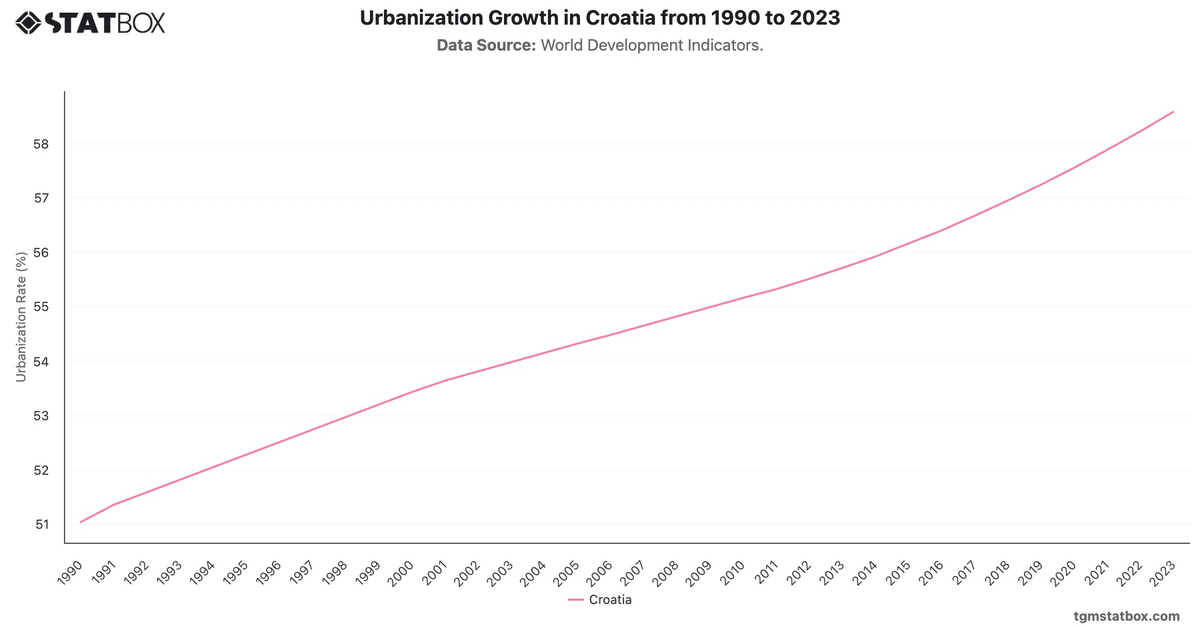
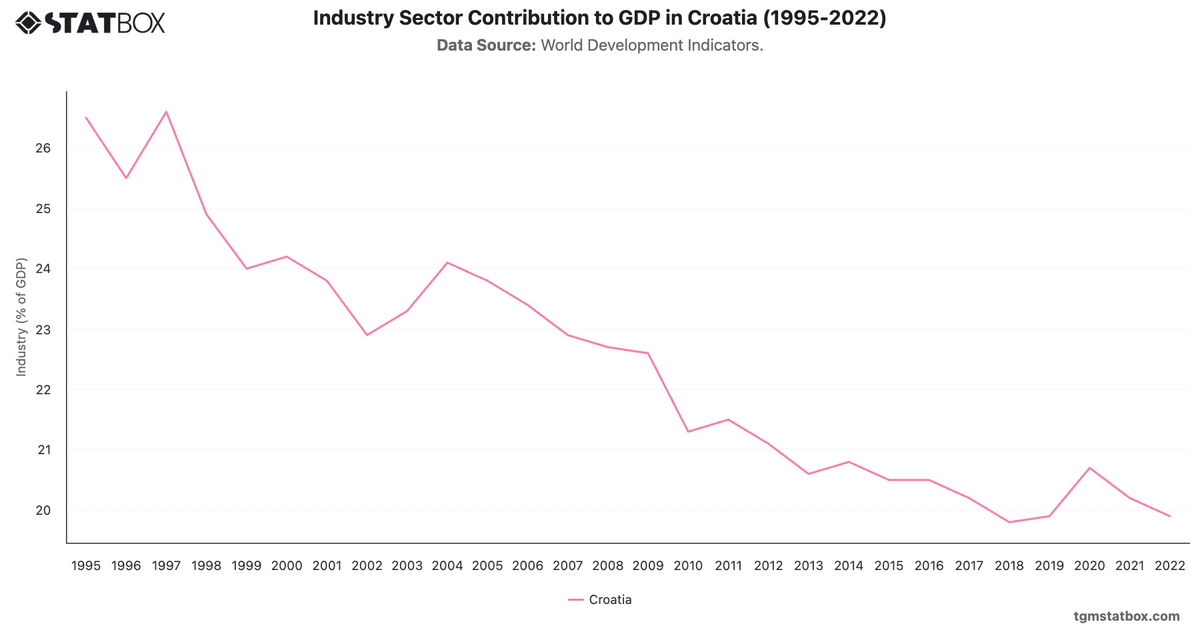
Explore related charts to gain a better understanding of Croatia’s industry sector share in GDP, rise in urbanization in croatia, Croatia’s unemployment rate.