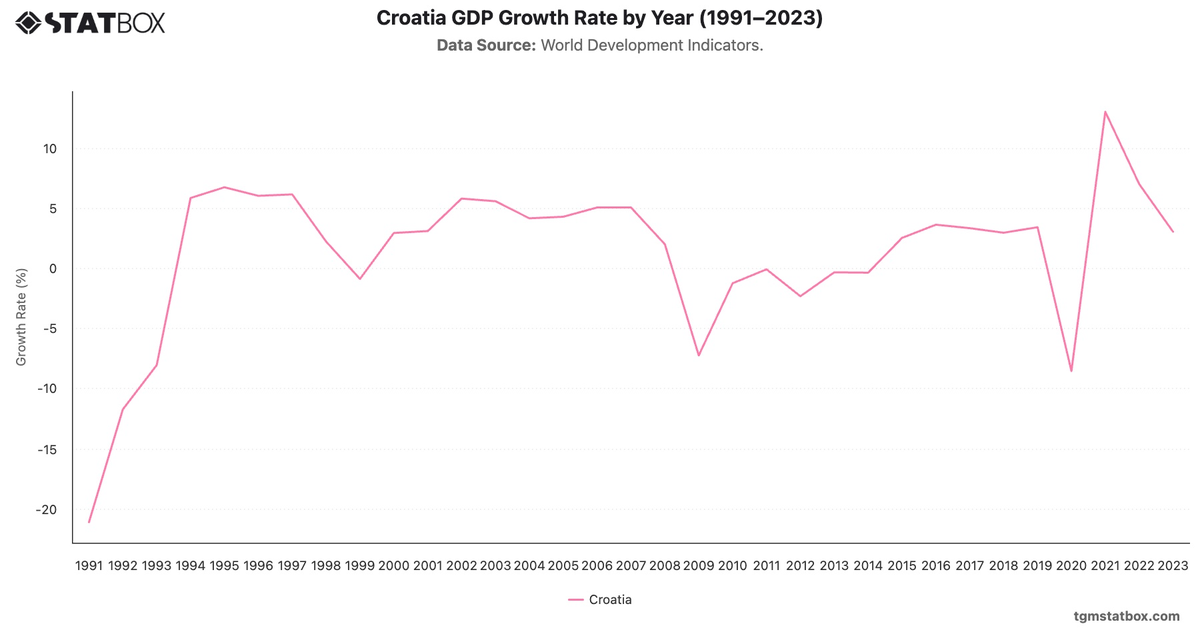
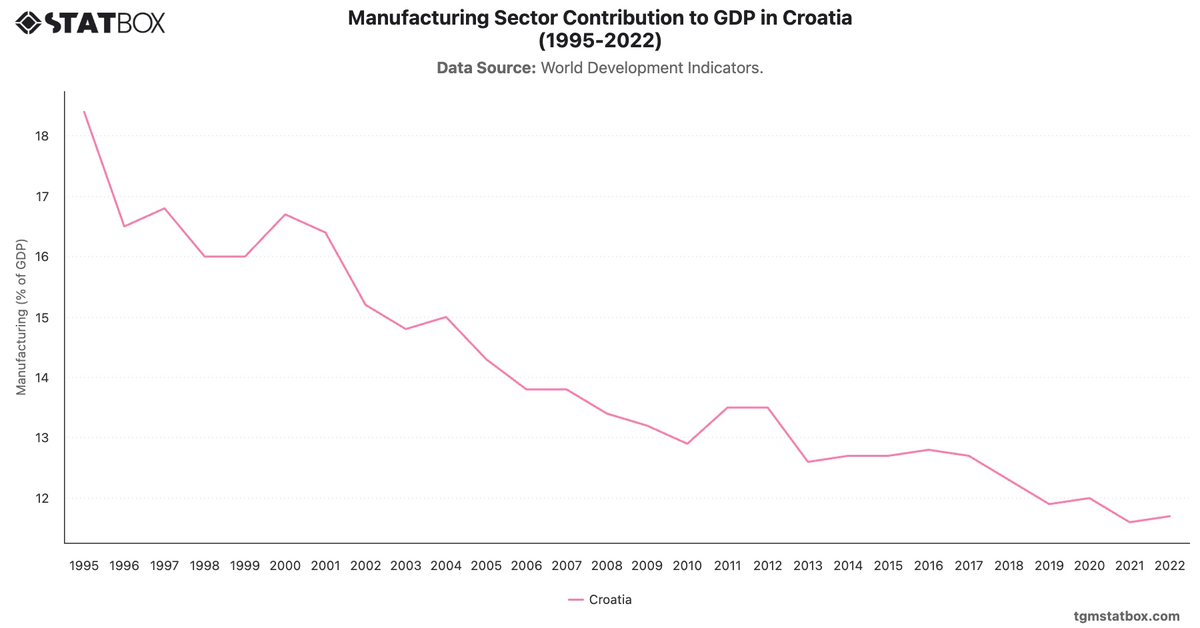
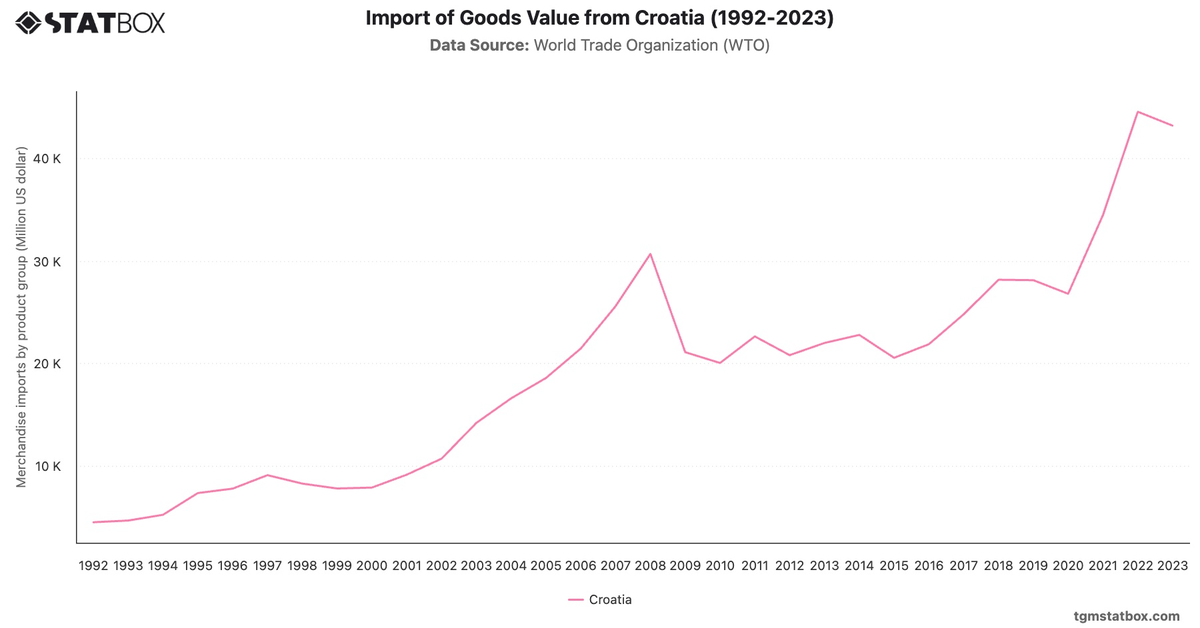
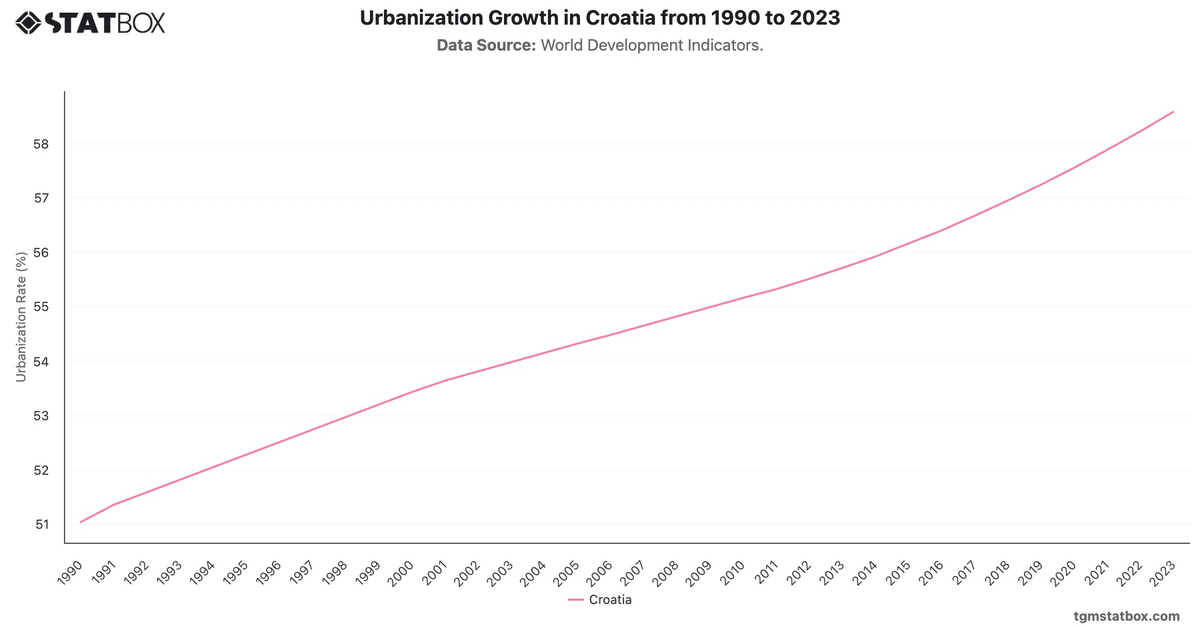
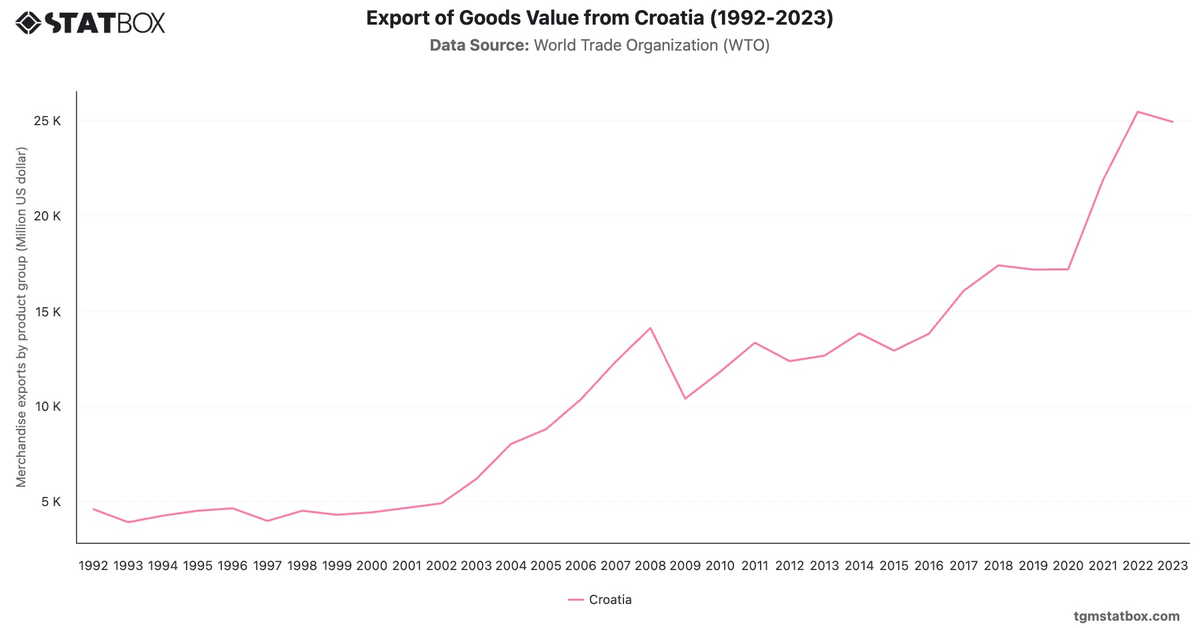
Since 1995, Croatia’s industry sector contribution has trended downward, from 26.5% to a stable range around 20% in recent years. The decline reflects Croatia’s post-independence economic restructuring and integration into the EU, which shifted focus from industry to service-oriented growth, particularly tourism. The financial crisis of 2008 also impacted industrial output, but recent stability around 20% shows efforts to modernize industrial capacities while balancing growth with service industries. This balance signifies Croatia's commitment to sustaining its industrial base within a diversified economic framework.
For a broader context, visit other statistics on Croatia’s manufacturing sector share in GDP, Croatia’s services sector share in GDP, Croatia’s agricultural contribution to GDP.