Romania’s imports surged from $7.6B in 1990 to $132.5B in 2022, highlighting its economic transformation. EU accession in 2007 drove imports from $70.3B in 2007 to $84.0B in 2008. A post-crisis recovery brought imports to $116.2B in 2021, supported by industrial expansion.
By 2023, imports stabilized at $131.9B, reflecting Romania’s integration into EU supply chains and its focus on industrial and consumer goods. Romania’s growth underscores its role in regional trade.
By 2023, imports stabilized at $131.9B, reflecting Romania’s integration into EU supply chains and its focus on industrial and consumer goods. Romania’s growth underscores its role in regional trade.
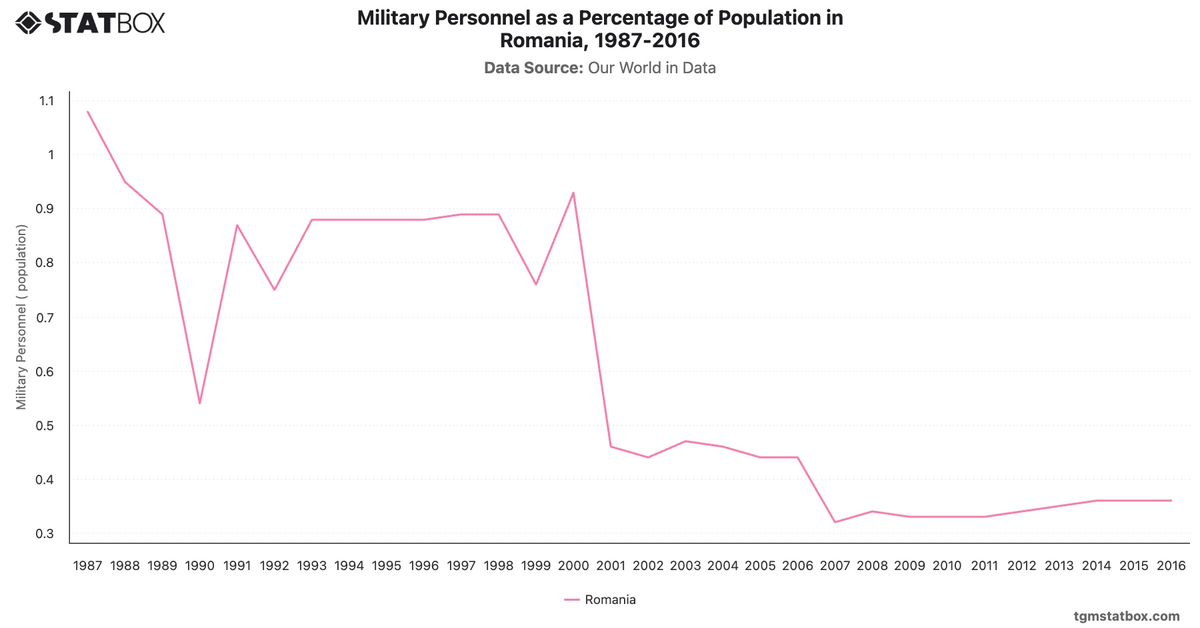
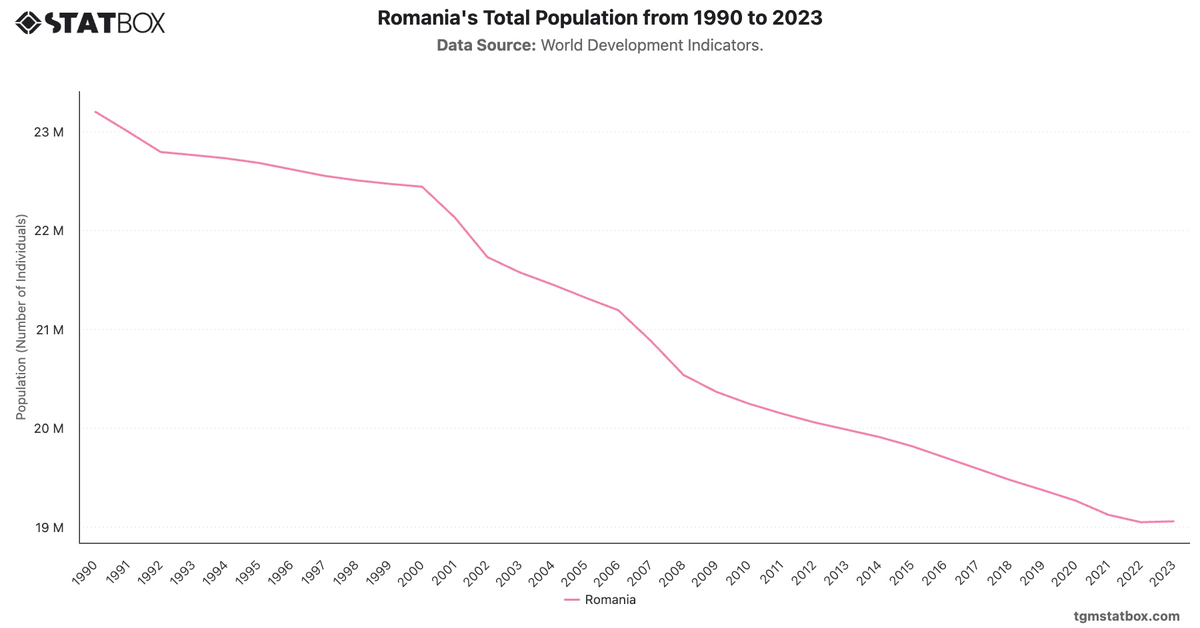
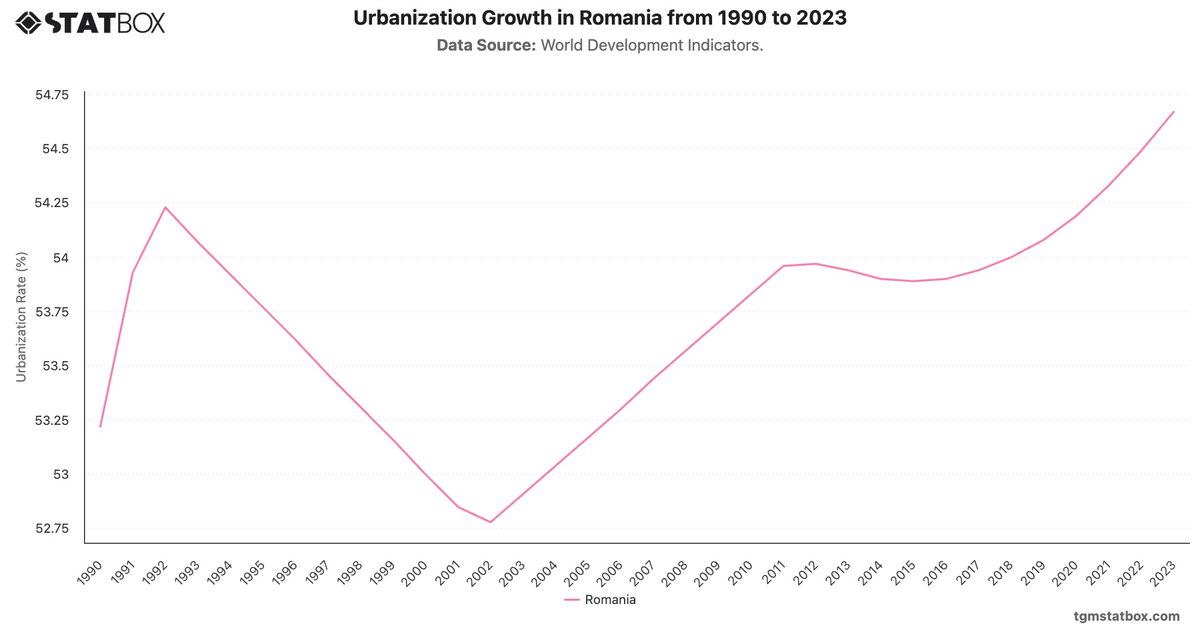
Discover additional trends and data on Romania’s urbanization rate, Romania’s military personnel overview, Romania’s population statistics.