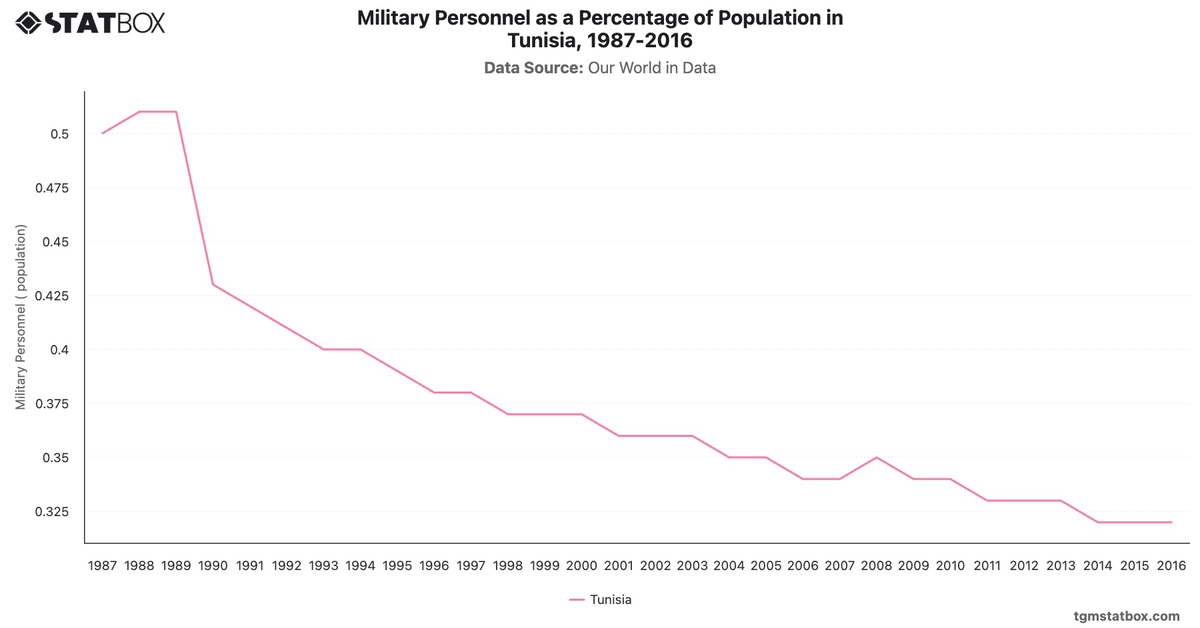
Tunisia's military spending as a percentage of GDP varied with its internal and regional challenges. Peaks in the early 1980s, such as 4.2% in 1983, aligned with political unrest and external pressures. However, expenditure decreased significantly in the 1990s as Tunisia prioritized economic reforms.
Post-Arab Spring in 2011, spending rose moderately to address security threats, including terrorism, peaking at 2.7% in 2020. By 2022, expenditure slightly declined to 2.5%, reflecting ongoing fiscal challenges and the balancing of domestic and defense priorities.
Post-Arab Spring in 2011, spending rose moderately to address security threats, including terrorism, peaking at 2.7% in 2020. By 2022, expenditure slightly declined to 2.5%, reflecting ongoing fiscal challenges and the balancing of domestic and defense priorities.
For additional information, visit statistics on Tunisia’s military personnel overview, Tunisia’s manufacturing sector share in GDP, Tunisia’s net ODA received.