Tunisia's Net ODA (% of GNI) declined sharply from 3.3% in 1990 to 0.4% in 1995 as its economy stabilized following structural adjustment programs. Peaks in 2011-2012, at 2.0% and 2.3%, respectively, reflect donor support during the Arab Spring and subsequent democratic transition.
Recent increases to 2.7% in 2022 correspond to international efforts addressing Tunisia's ongoing economic and governance challenges. Despite fluctuations, ODA remains a critical factor in Tunisia's development strategy.
Recent increases to 2.7% in 2022 correspond to international efforts addressing Tunisia's ongoing economic and governance challenges. Despite fluctuations, ODA remains a critical factor in Tunisia's development strategy.
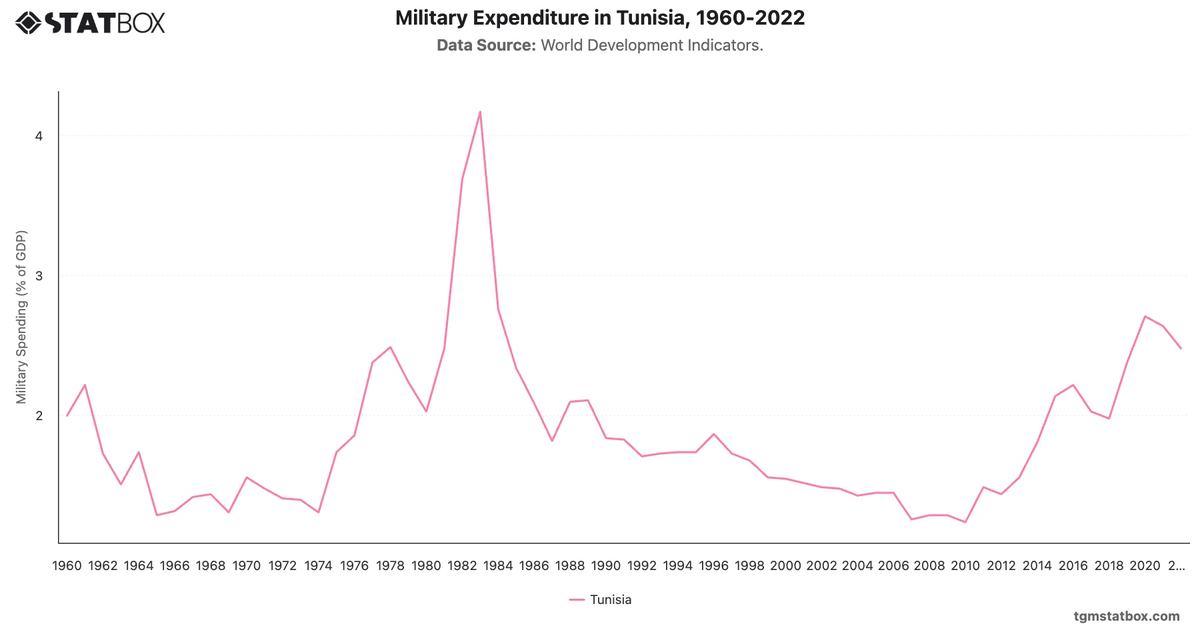
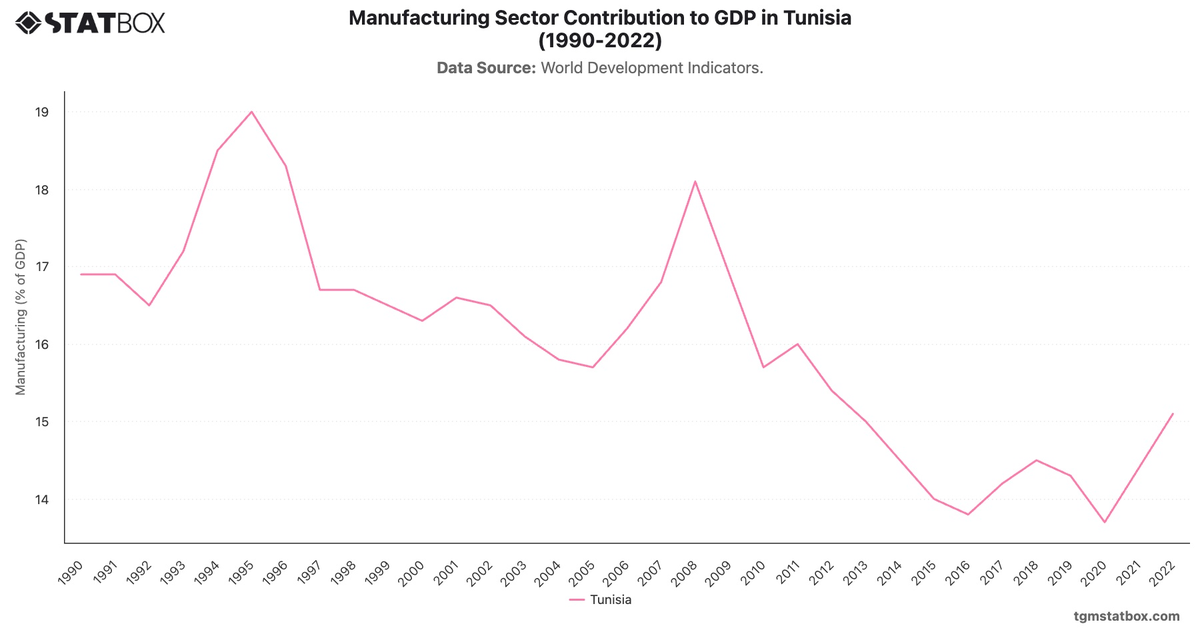
Find out more through related statistics on Tunisia’s manufacturing sector share in GDP, Tunisia’s population total, Tunisia’s military spending.