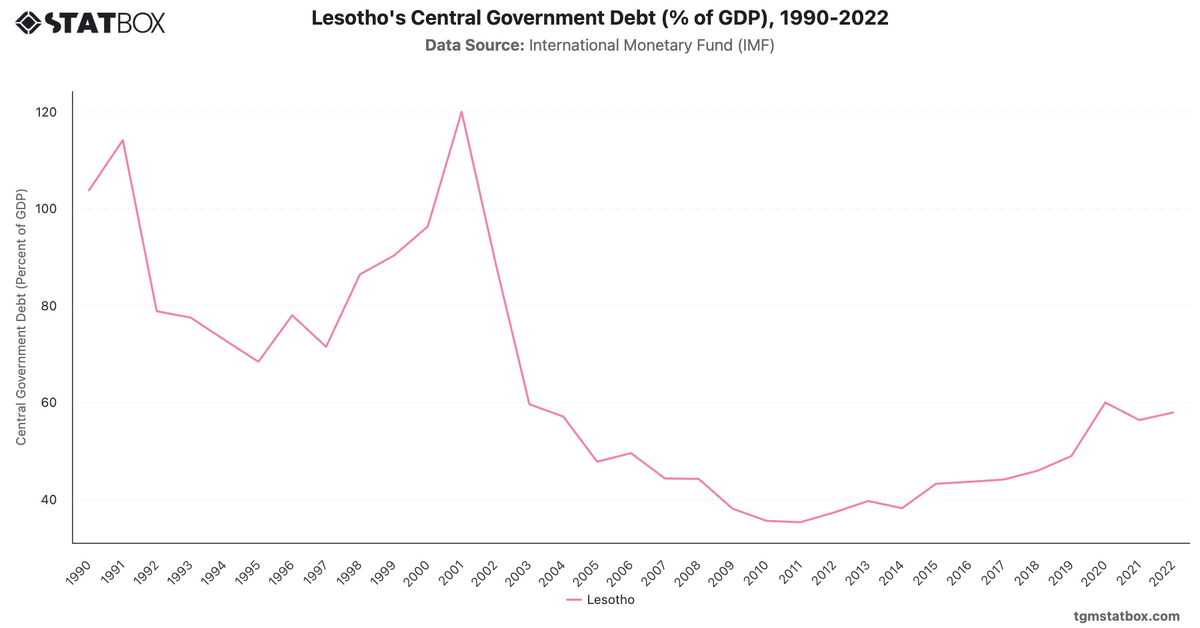
Lesotho's fiscal trends reveal significant volatility due to its reliance on external factors such as regional trade. The early 1990s saw surpluses, peaking at 9.7% in 1991. However, political instability and economic shocks led to deep deficits, including -15.3% in 1999.
Recent years show recovery, with surpluses reappearing in 2023 (3.1%). However, deficits are forecast to reemerge by 2025 (-2.2%), reflecting challenges in achieving sustainable fiscal stability.
Recent years show recovery, with surpluses reappearing in 2023 (3.1%). However, deficits are forecast to reemerge by 2025 (-2.2%), reflecting challenges in achieving sustainable fiscal stability.
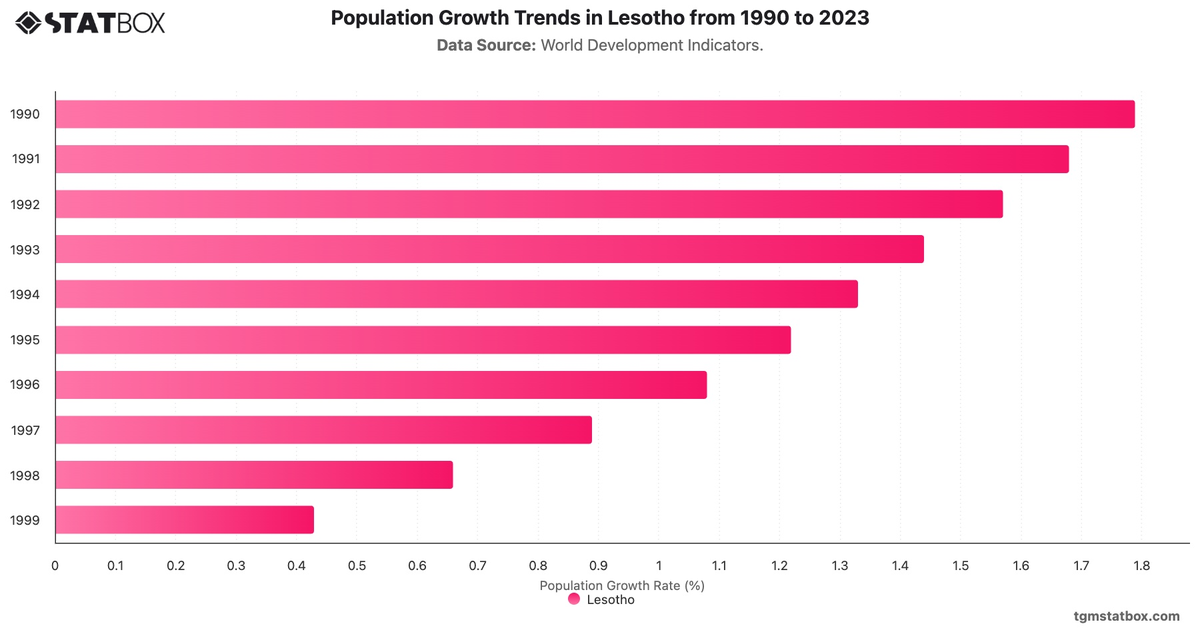
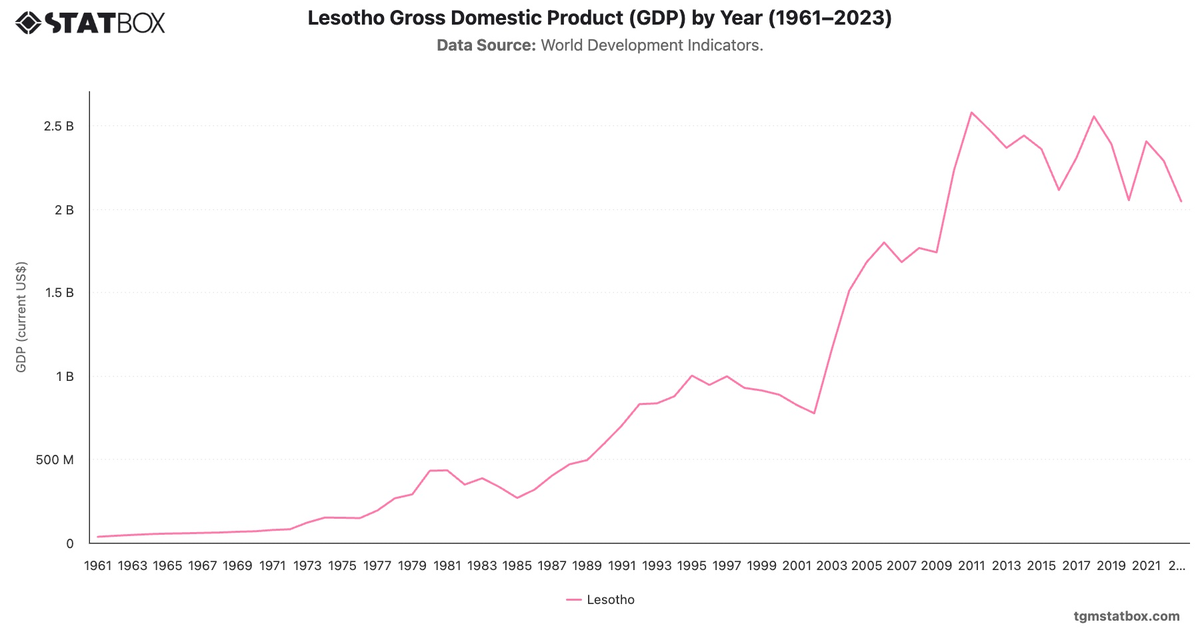
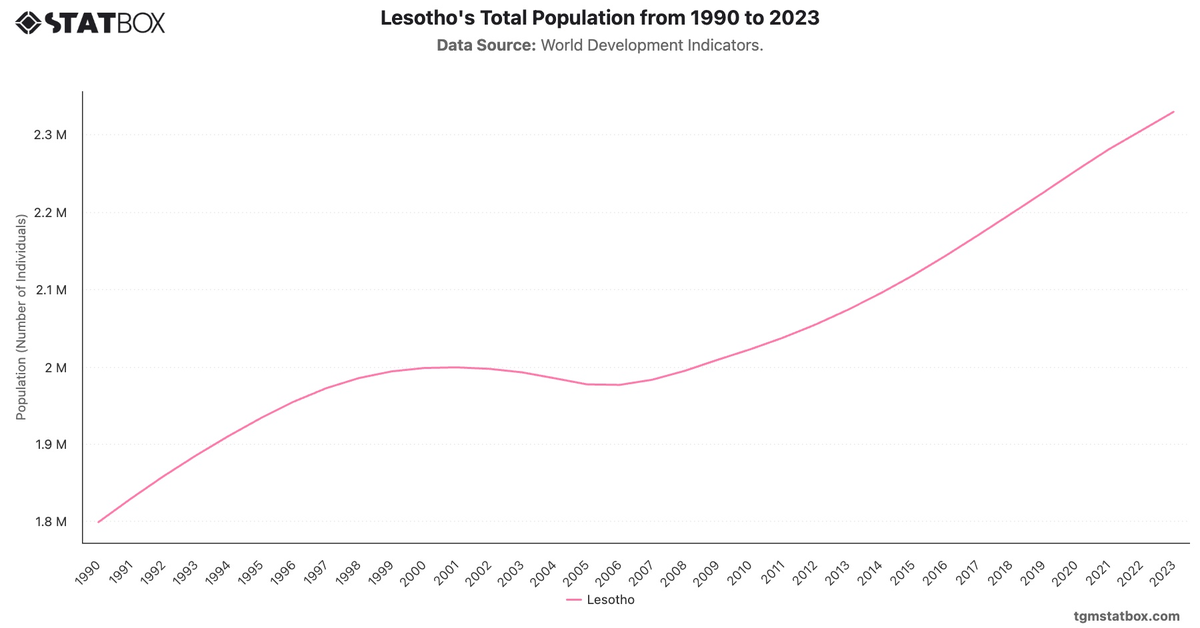
Gain a broader perspective by reviewing Lesotho’s annual GDP figures, Lesotho’s population growth, Lesotho’s goods trade balance.