France GDP Growth Rate by Year (1961-2023)
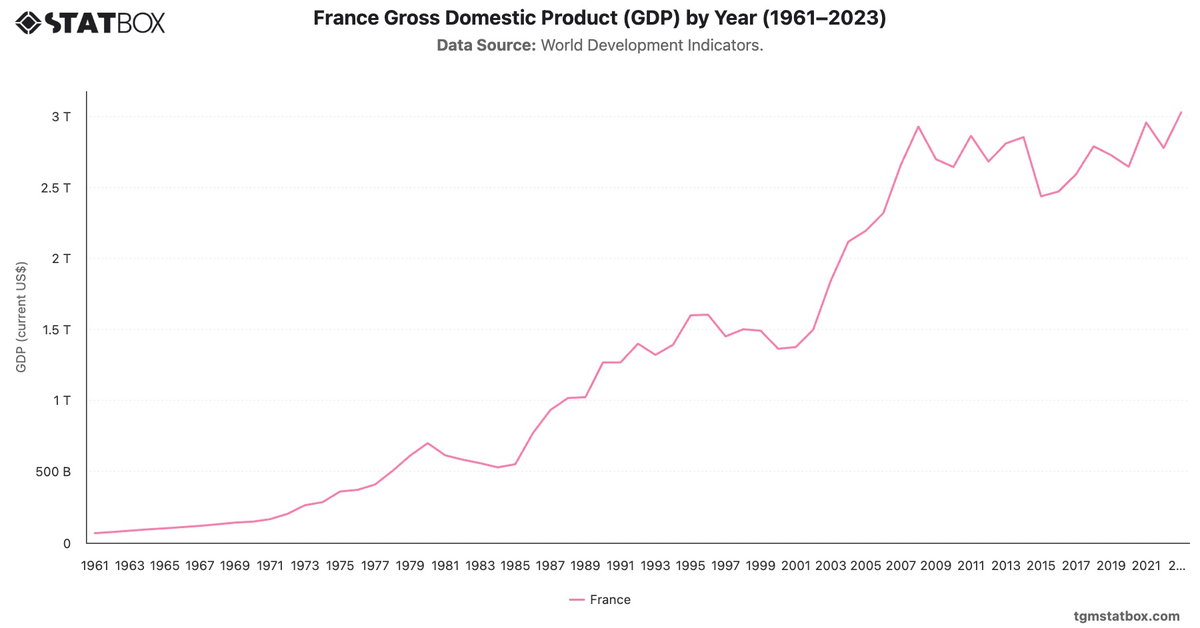
France's GDP growth rate highlights decades of varying economic fortunes. The 1960s and early 1970s saw growth rates above 6%, fueled by industrial expansion. The oil crisis of 1974 caused a contraction of -1.0%, leading to subdued performance through the 1980s. A brief resurgence in the late 1990s gave way to more modest gains, interrupted by the 2009 financial crisis with a -2.9% decline.
The pandemic brought a severe -7.5% contraction in 2020, yet recovery was swift, with 6.4% growth in 2021. Despite some moderation, growth was positive at 0.7% in 2023, reflecting both post-pandemic recovery and challenges in the global economic landscape.
For a broader context, visit other statistics on France’s government debt-to-GDP ratio, urbanization rate in France, France’s industry sector GDP share.