Spain GDP Growth Rate by Year (1961-2023)
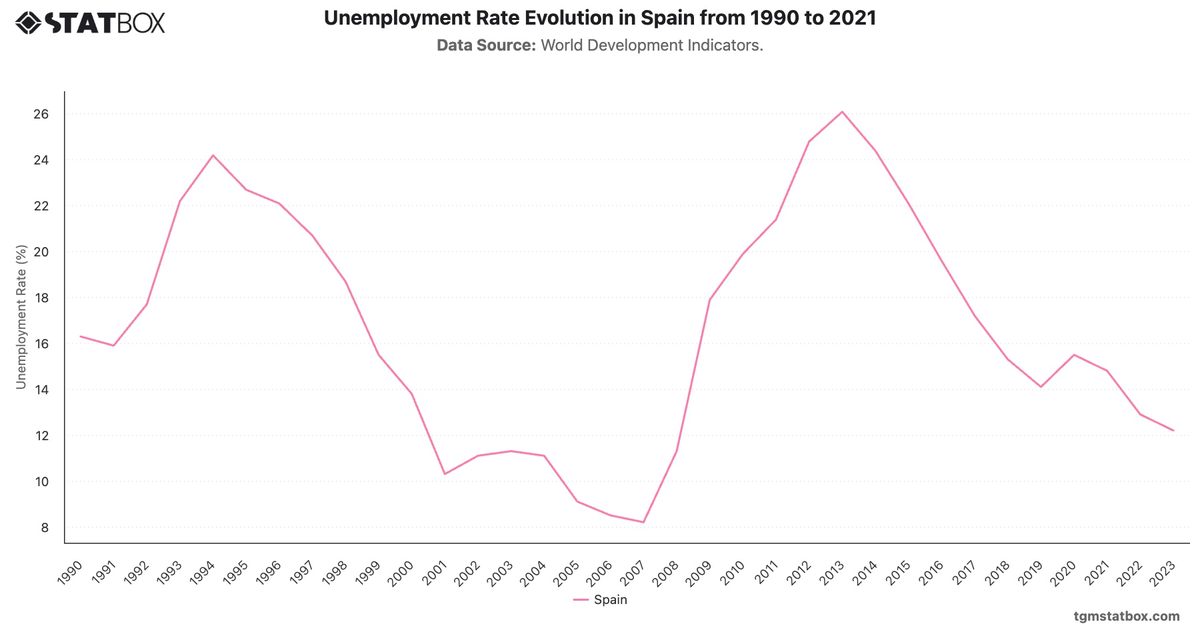
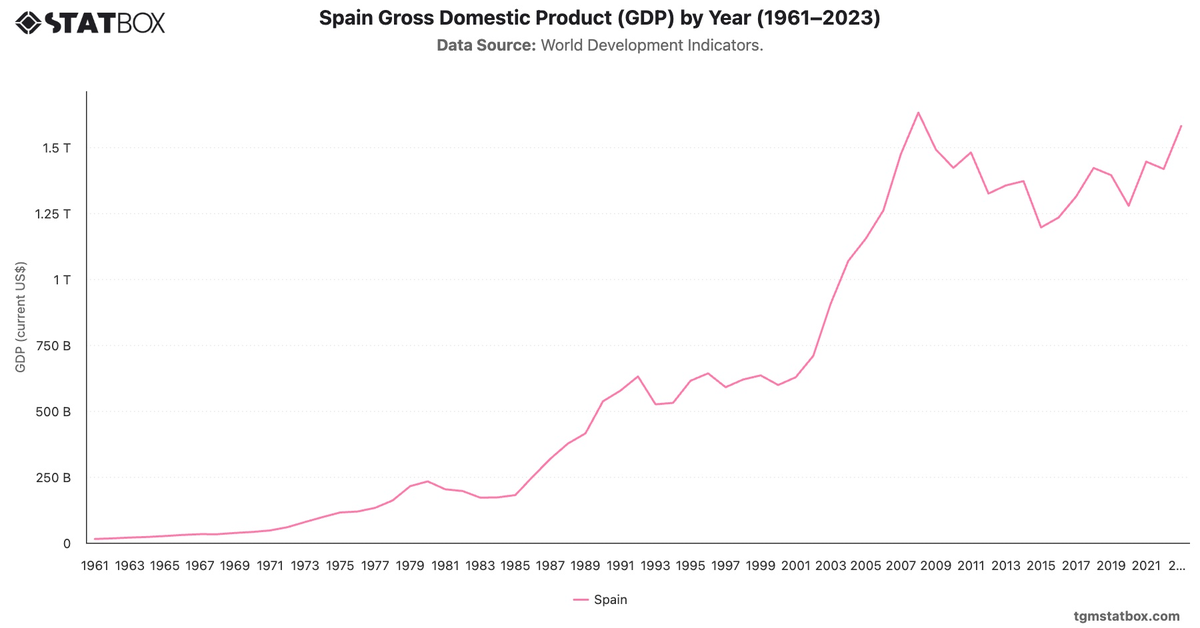
Spain’s growth history reflects periods of strong expansion and severe crises. The 1960s were marked by impressive double-digit growth, peaking at 11.8% in 1961. However, the 1975 global recession and energy crisis led to stagnation, with only 0.5% growth. Recovery ensued in the late 1980s, driven by structural reforms and EU integration.
The global financial crisis of 2009 hit Spain hard, contracting GDP by -3.8%, with a slow and uneven recovery. The pandemic's impact in 2020 was even sharper, causing a significant -11.2% contraction. However, a robust recovery followed, with 6.4% in 2021 and a continued upswing to 5.8% in 2022, before settling at 2.5% in 2023 amid global economic adjustments.
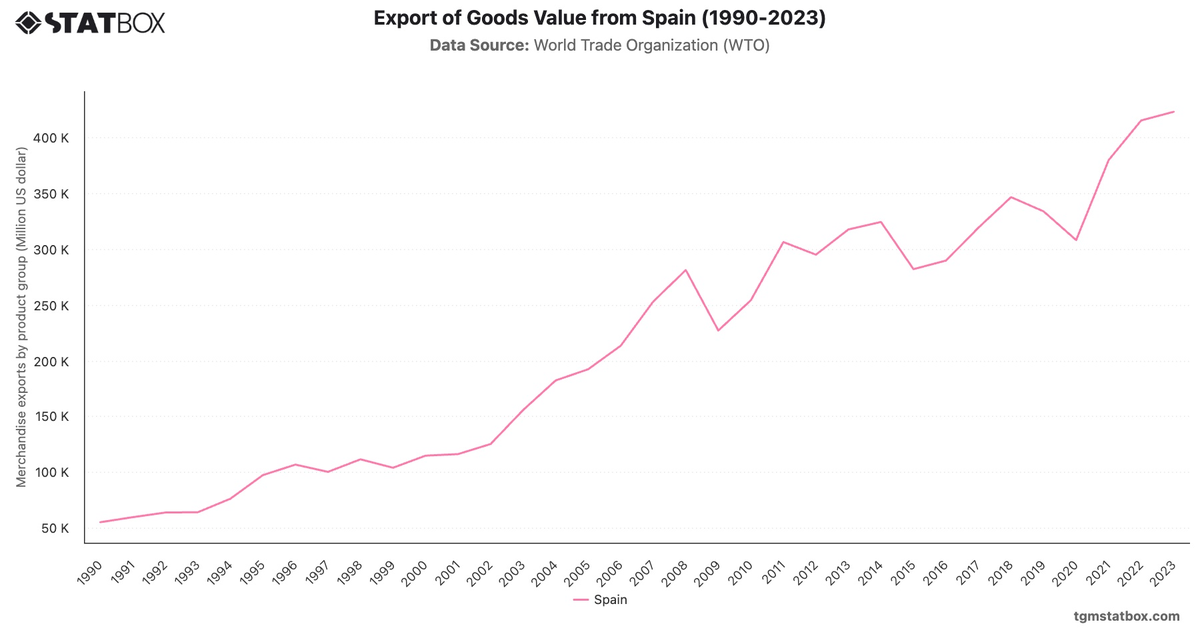
For a broader context, visit other statistics on Spain’s export value, Spain’s urbanization rate, Spain’s annual GDP.