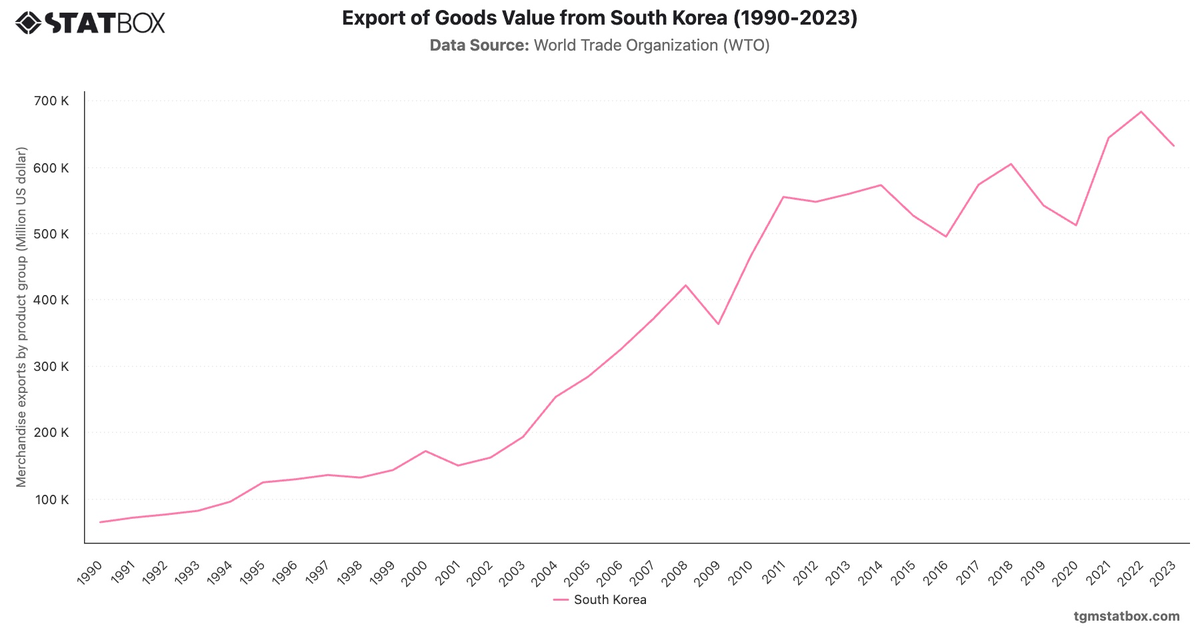
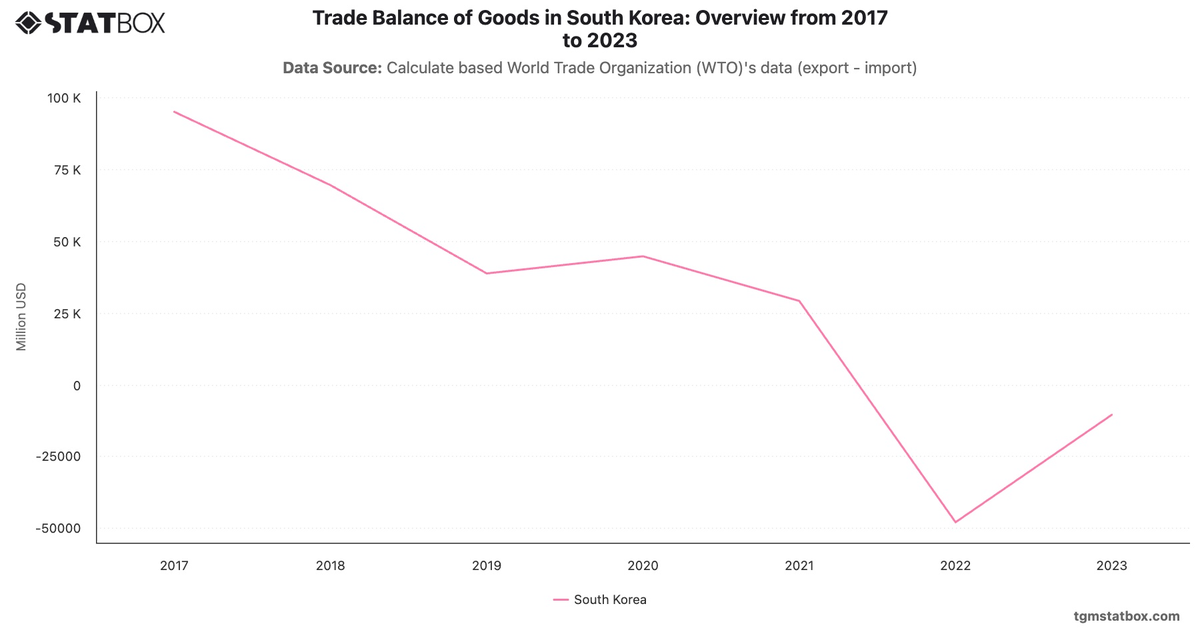
South Korea's imports surged from $69.8B in 1990 to $731.4B in 2022, reflecting rapid industrialization and global trade integration. The 1990s saw strong growth, with imports doubling to $160.5B by 2000, driven by the electronics and automotive sectors.
While the 1997 Asian financial crisis caused a dip to $93.3B in 1998, recovery was swift. A steady climb through the 2000s, reaching $435.3B in 2008, underscored South Korea’s position as an industrial leader. Post-pandemic recovery and energy demand pushed imports to a record high in 2022, followed by stabilization at $642.6B in 2023.
While the 1997 Asian financial crisis caused a dip to $93.3B in 1998, recovery was swift. A steady climb through the 2000s, reaching $435.3B in 2008, underscored South Korea’s position as an industrial leader. Post-pandemic recovery and energy demand pushed imports to a record high in 2022, followed by stabilization at $642.6B in 2023.
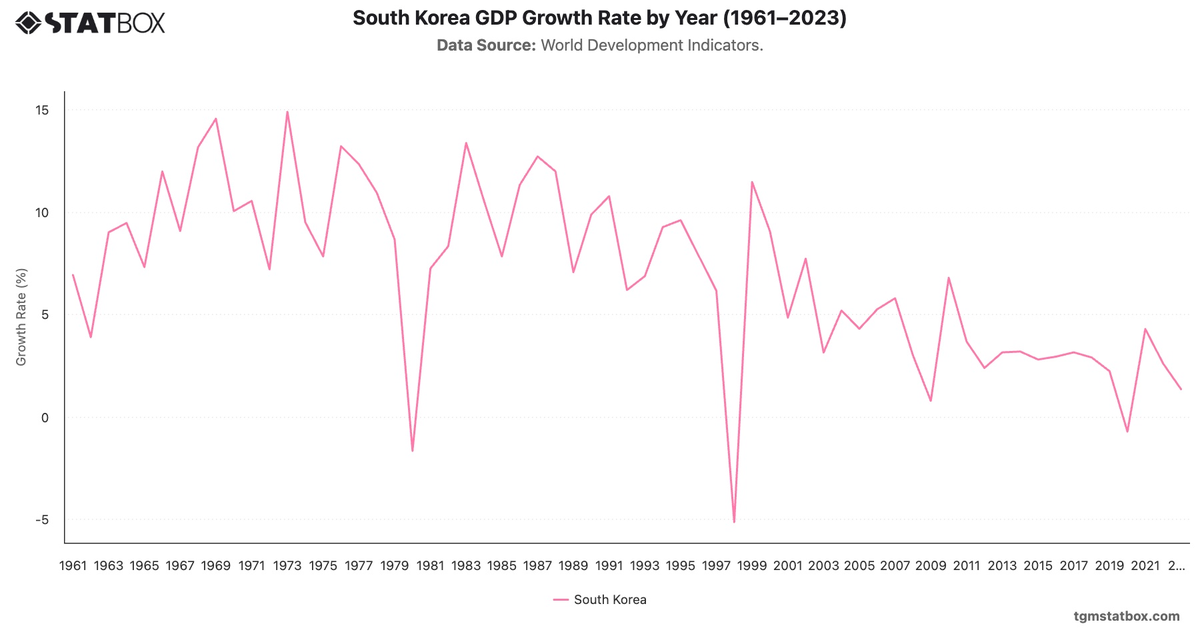
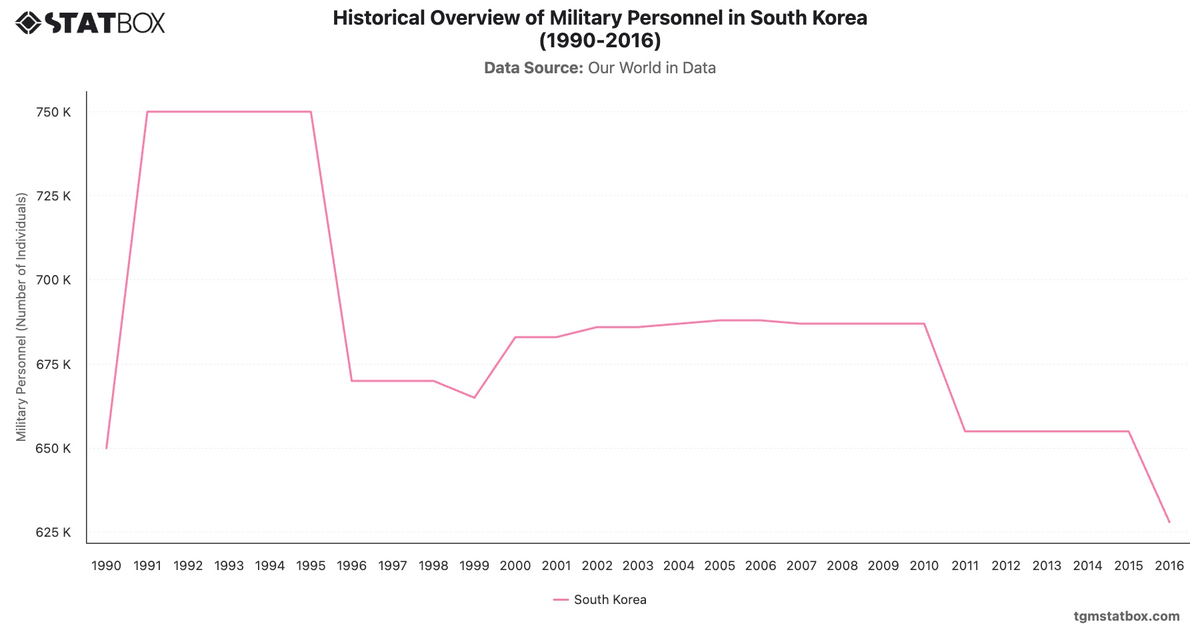
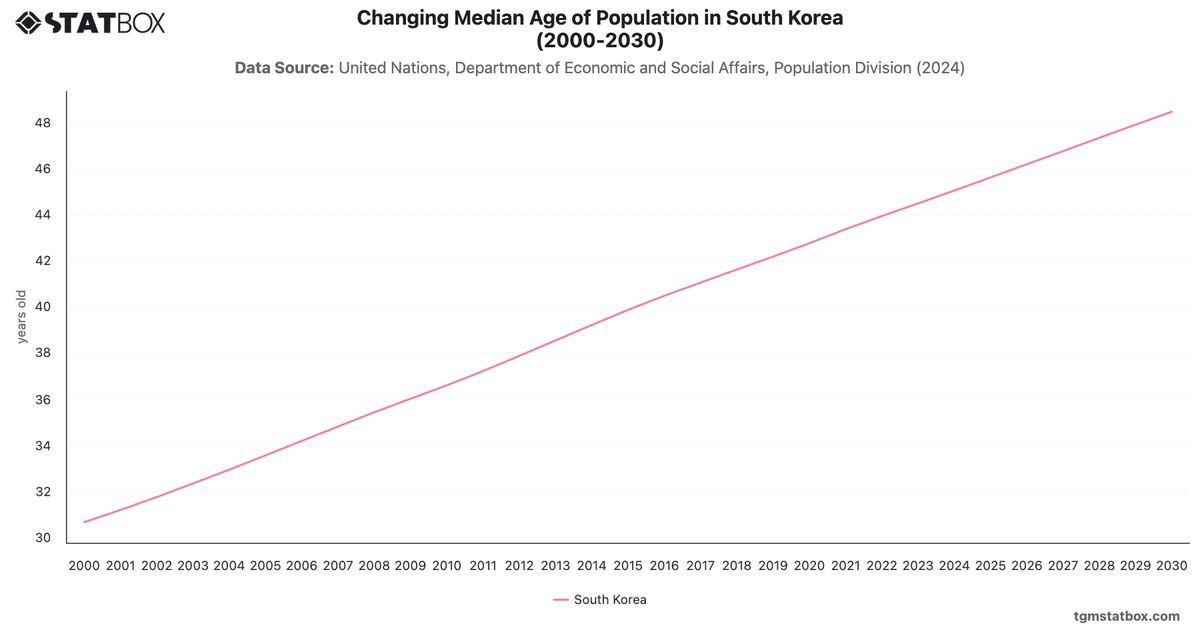
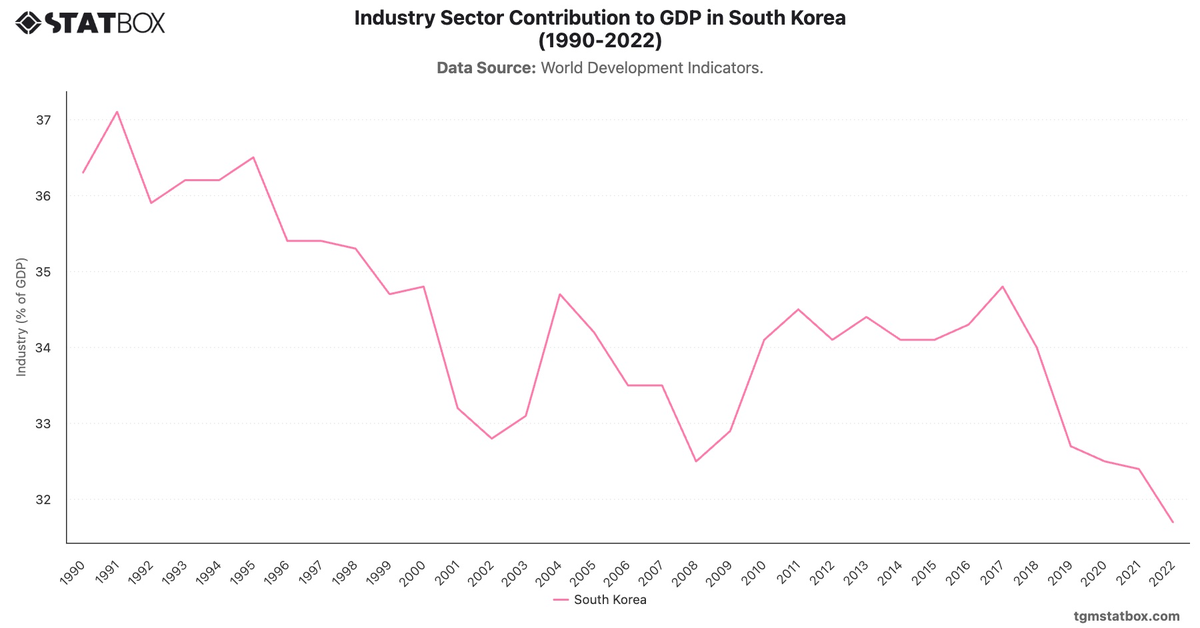
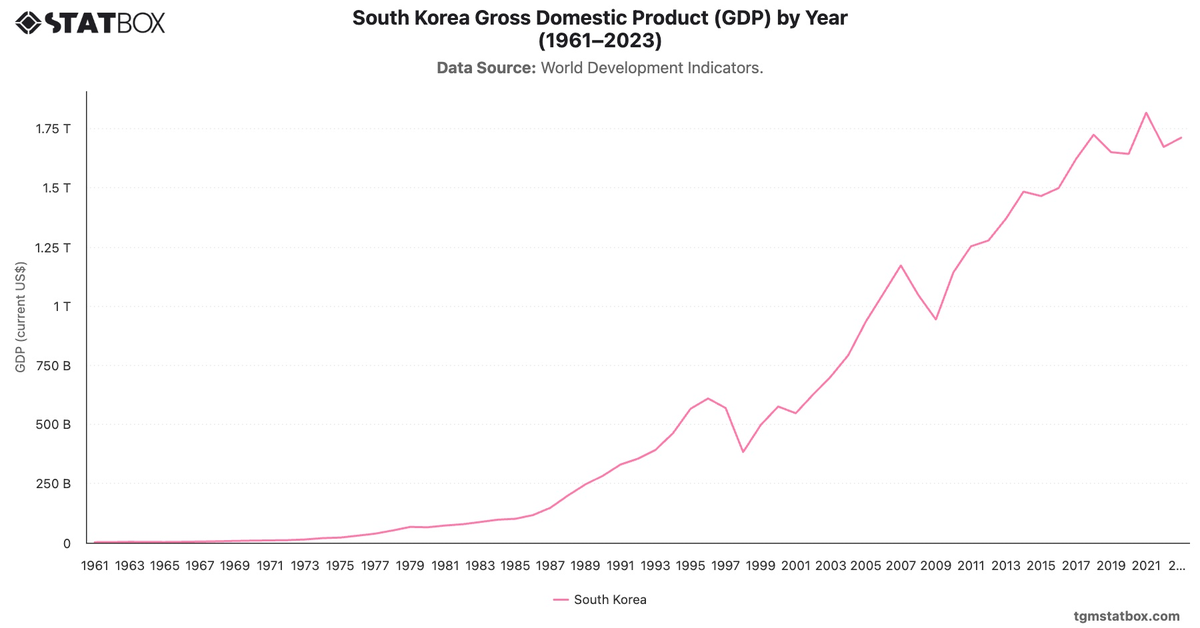
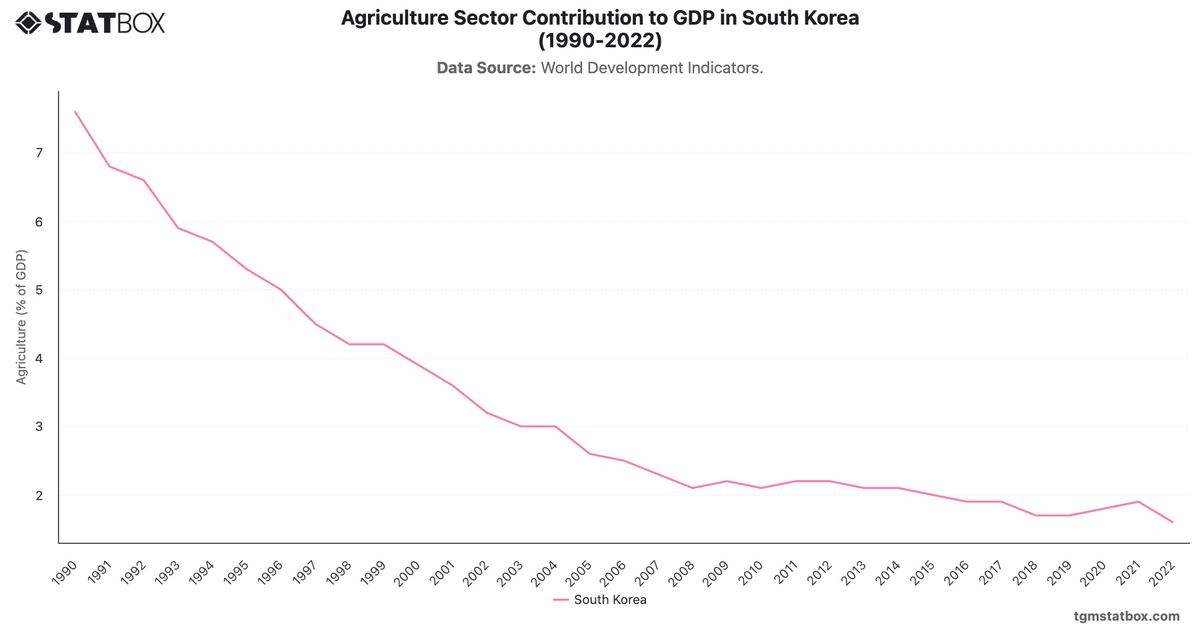
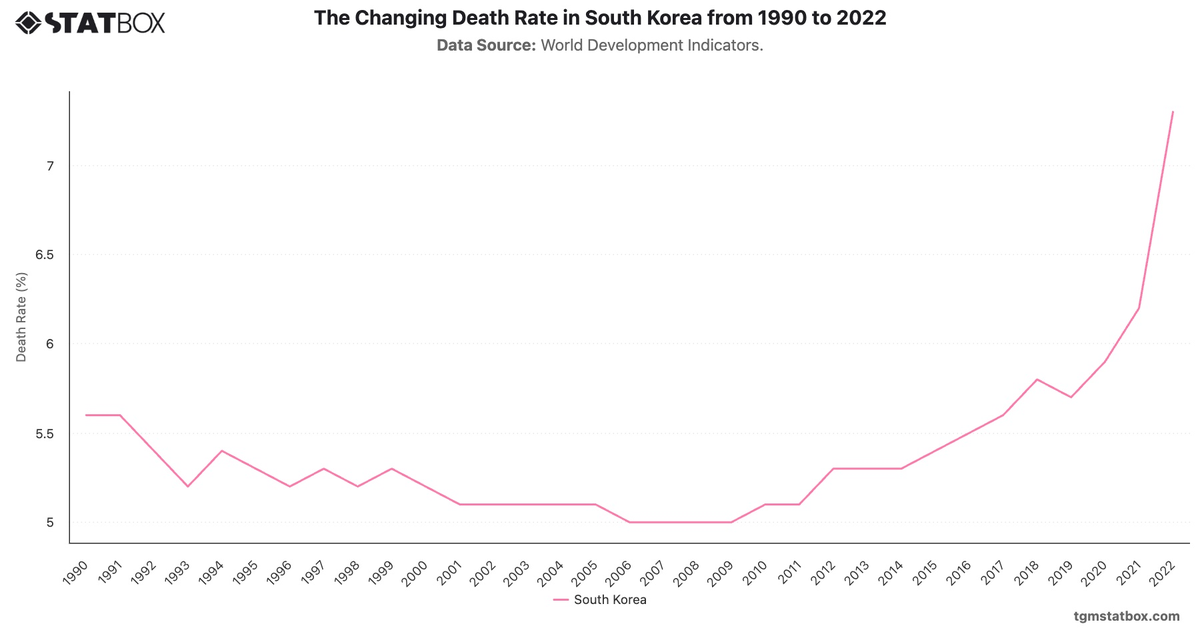
Explore related charts to gain a better understanding of South Korea’s urbanization rate, Manufacturing sector’s GDP share in South Korea, South Korea’s annual GDP.