Serbia’s Net ODA (% of GNI) peaked at 16.5% in 2000 during the post-Milošević transition, reflecting international support for rebuilding democratic institutions and economic reforms. Aid levels declined throughout the 2000s, stabilizing around 1%-2% as Serbia progressed toward EU integration.
A spike in 2017 (4.1%) suggests increased donor engagement, possibly linked to regional stabilization and infrastructure investments. By 2022, ODA had declined to 0.8%, signaling Serbia’s reduced reliance on external aid as it moves toward self-sufficiency.
A spike in 2017 (4.1%) suggests increased donor engagement, possibly linked to regional stabilization and infrastructure investments. By 2022, ODA had declined to 0.8%, signaling Serbia’s reduced reliance on external aid as it moves toward self-sufficiency.
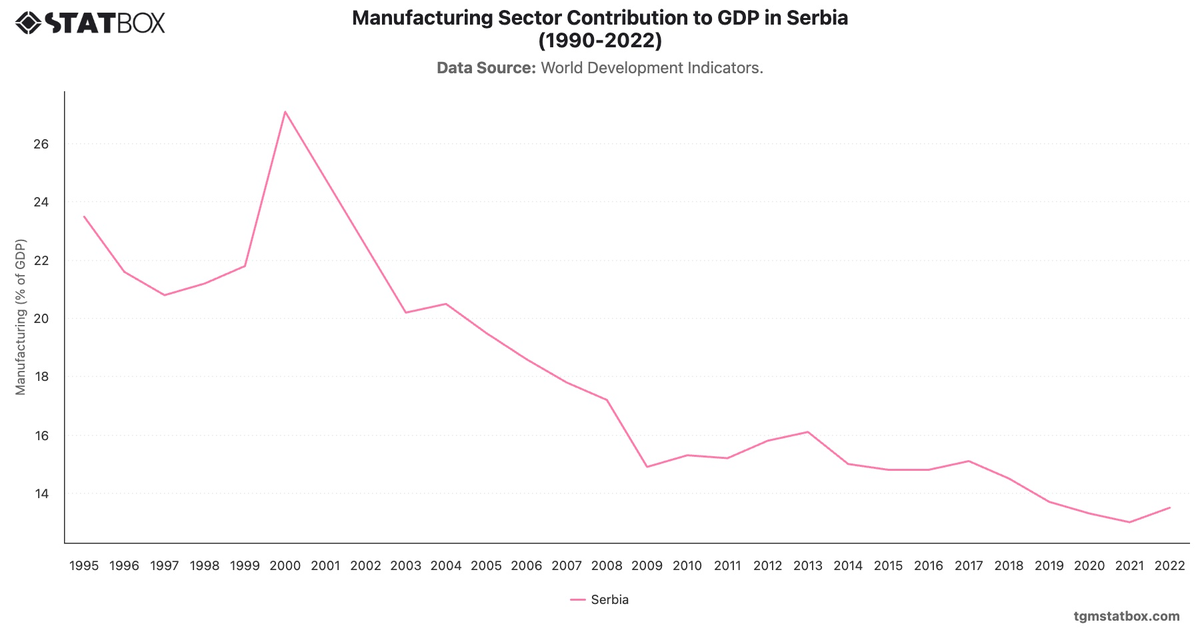
For a deeper dive into the topic, explore Serbia’s inflation rate overview, percentage of military personnel in Serbia, Serbia’s manufacturing share in GDP.