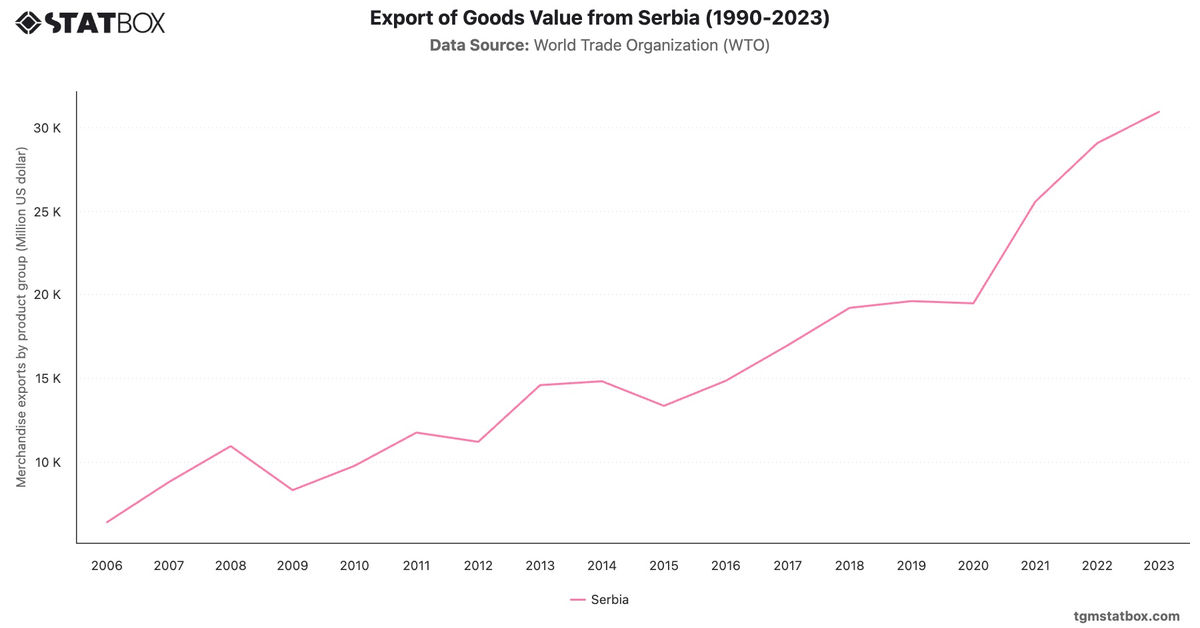
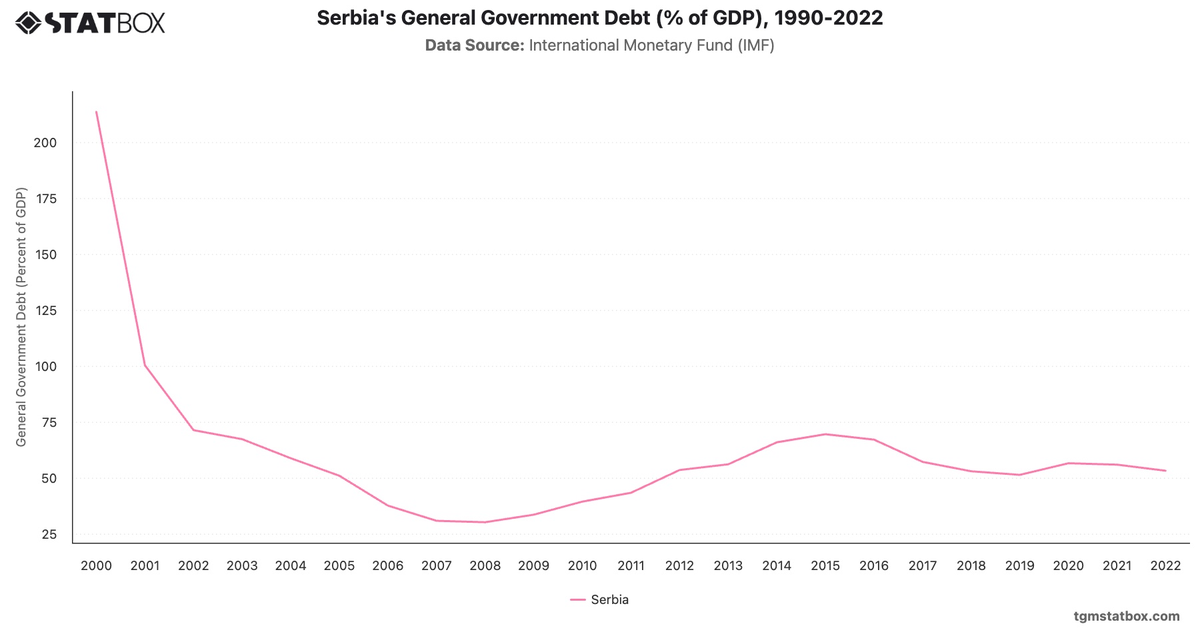
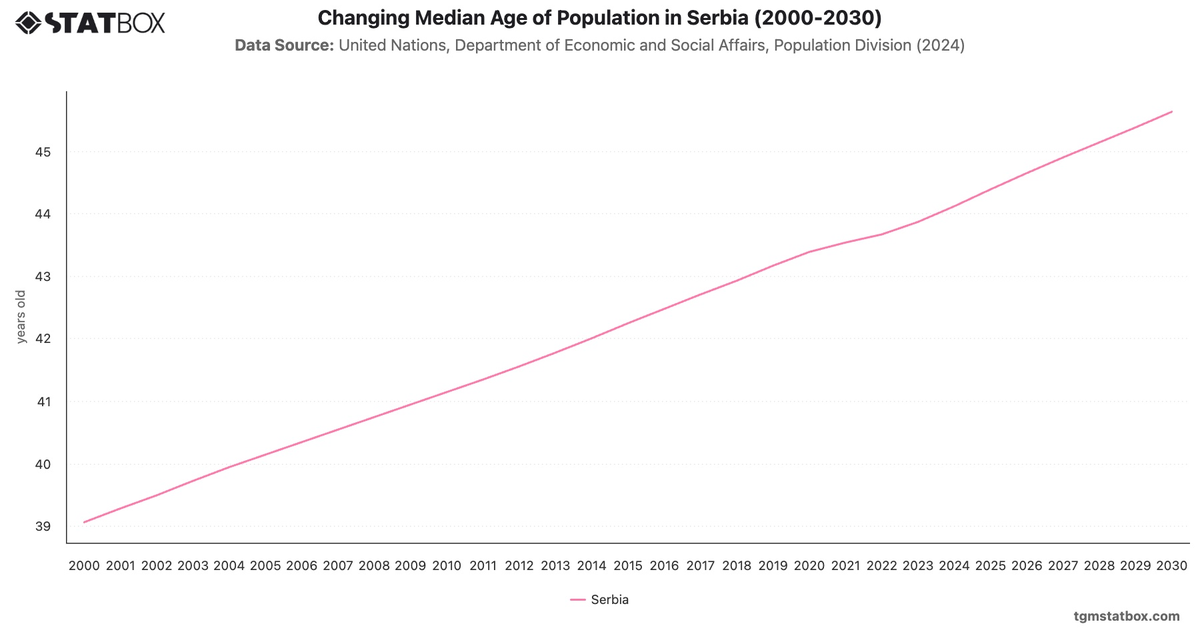
Serbia's fiscal trends highlight the impact of economic restructuring and external shocks. The early 2000s saw moderate deficits, but the global financial crisis widened the gap to -6.4% in 2012. Recovery efforts improved the balance, with a surplus of 1.4% in 2017.
The pandemic pushed the deficit to -7.2% in 2020, but forecasts indicate stabilization around -2.1% by 2029, reflecting Serbia’s commitment to fiscal discipline and economic resilience.
The pandemic pushed the deficit to -7.2% in 2020, but forecasts indicate stabilization around -2.1% by 2029, reflecting Serbia’s commitment to fiscal discipline and economic resilience.
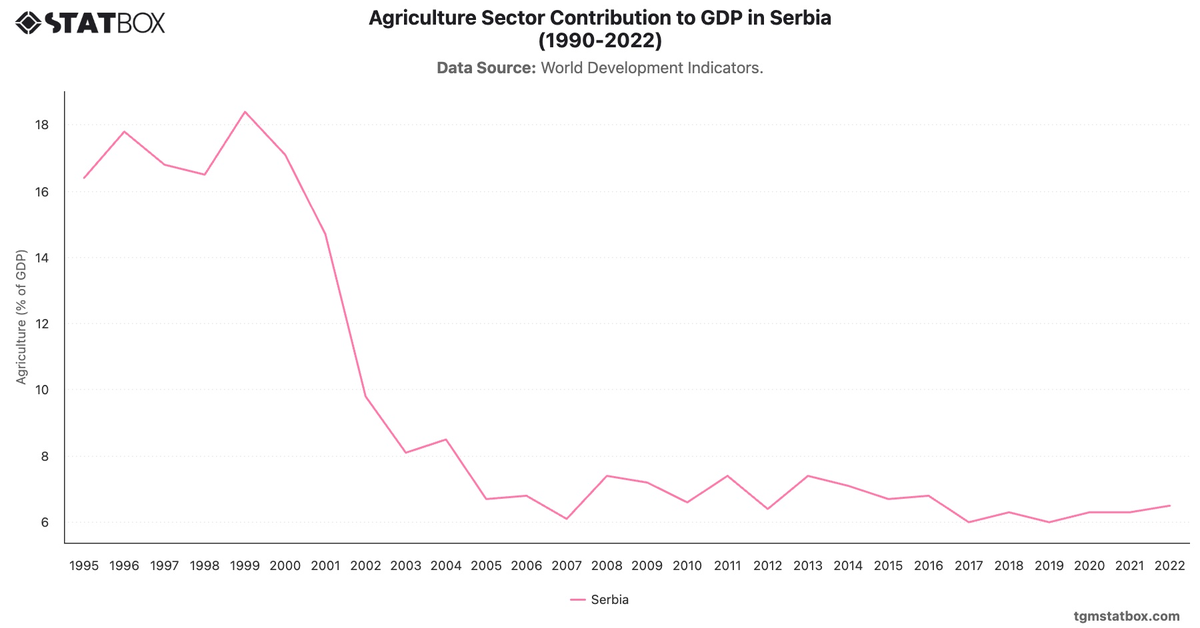
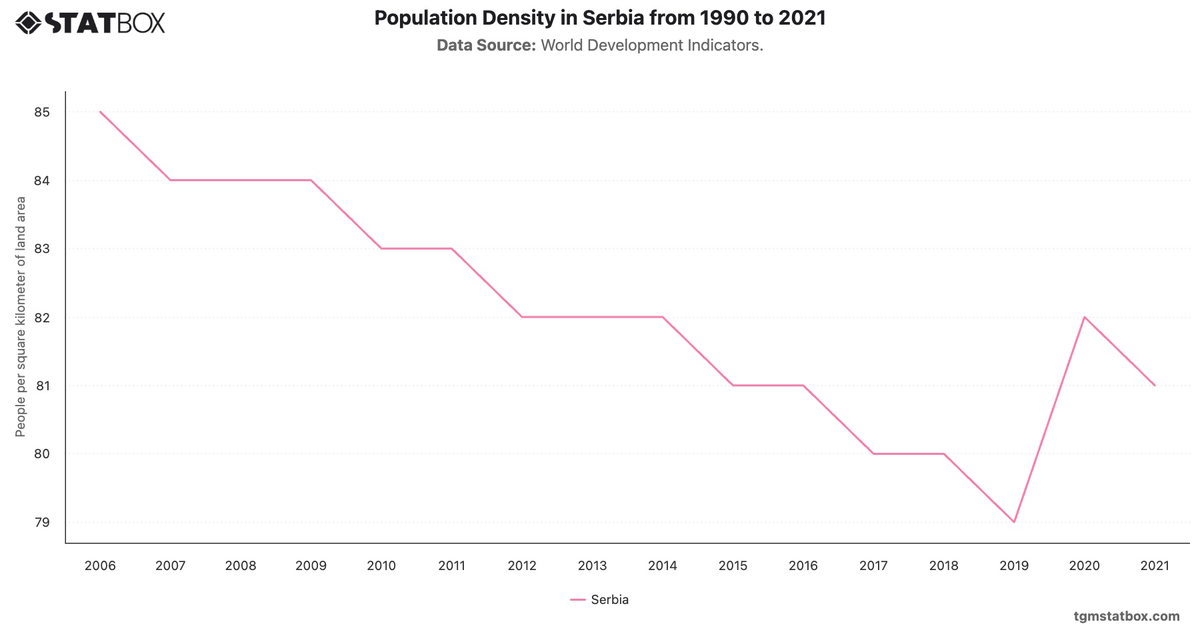
For a broader context, visit other statistics on Serbia’s inflation rate overview, agriculture’s GDP share in Serbia, Serbia’s population density.