Rwanda's Overall Balance (% of GDP): Net Lending/Borrowing Trends and Forecasts (1992-2029)

Rwanda's Overall Balance (% of GDP): Net Lending/Borrowing Trends and Forecasts (1992-2029)

Share the statistic on social media channels or embed the statistic in your website using "Embed Code", where available.

Share chart

Embed chart
Select Citation

Cite this statistic and select one of the following formats: APA, Chicago, Harvard, MLA & Bluebook


  • APA
  • Chicago
  • Harvard
  • MLA
  • Bluebook
  • IEEE
TGM StatBox. (2024). Rwanda's Overall Balance (% of GDP): Net Lending/Borrowing Trends and Forecasts (1992-2029). TGM StatBox.
Insights

Key Takeaways

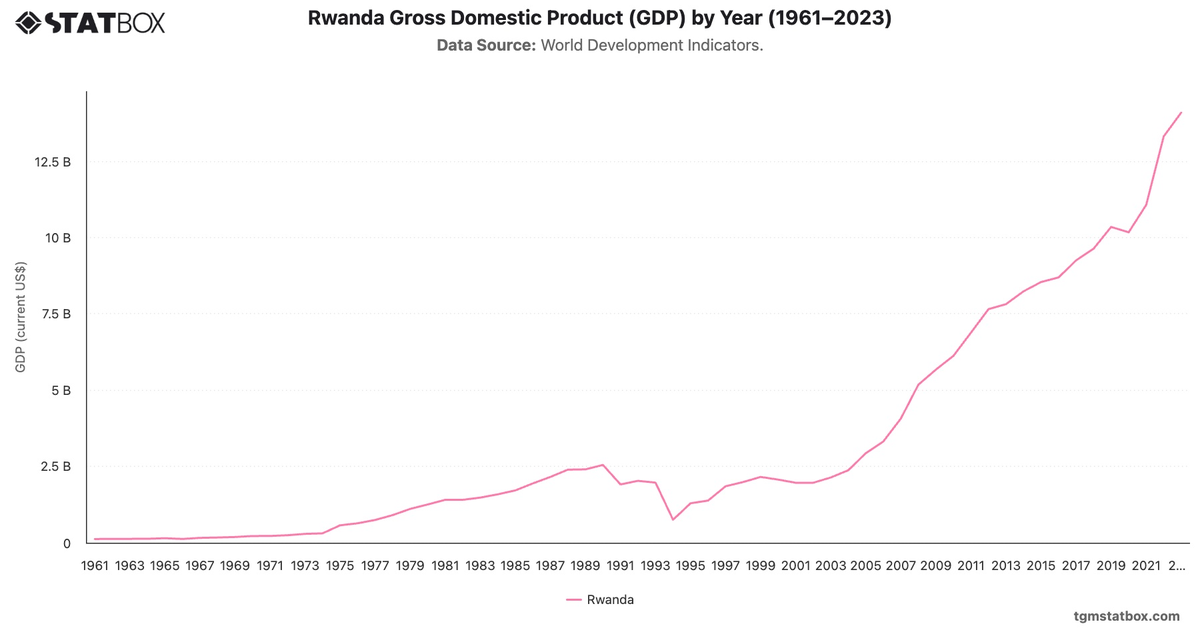
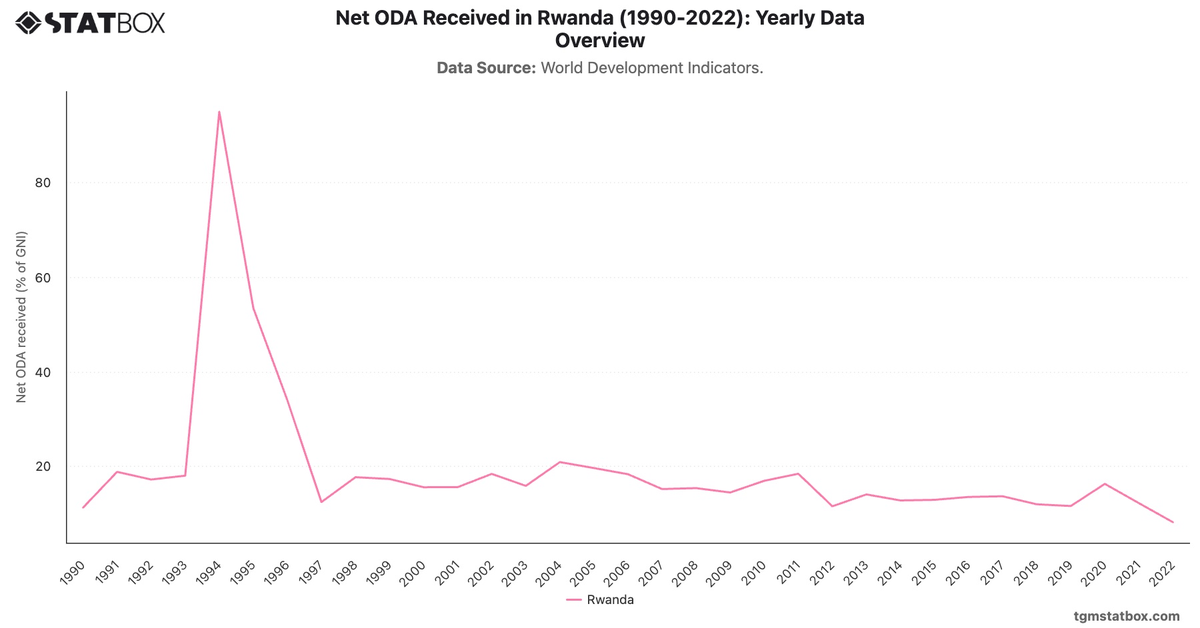
Rwanda's fiscal trends reflect a challenging post-conflict recovery and subsequent economic progress. The 1990s saw deep deficits, peaking at -9.5% in 1994 during the genocide. Economic stabilization and donor support brought significant improvement, with occasional surpluses in the 2000s, such as 2.3% in 2004.

However, the pandemic reversed gains, widening the deficit to -9.5% in 2020. Projections suggest narrowing deficits to -2.4% by 2029, supported by continued economic growth and improved revenue mobilization.

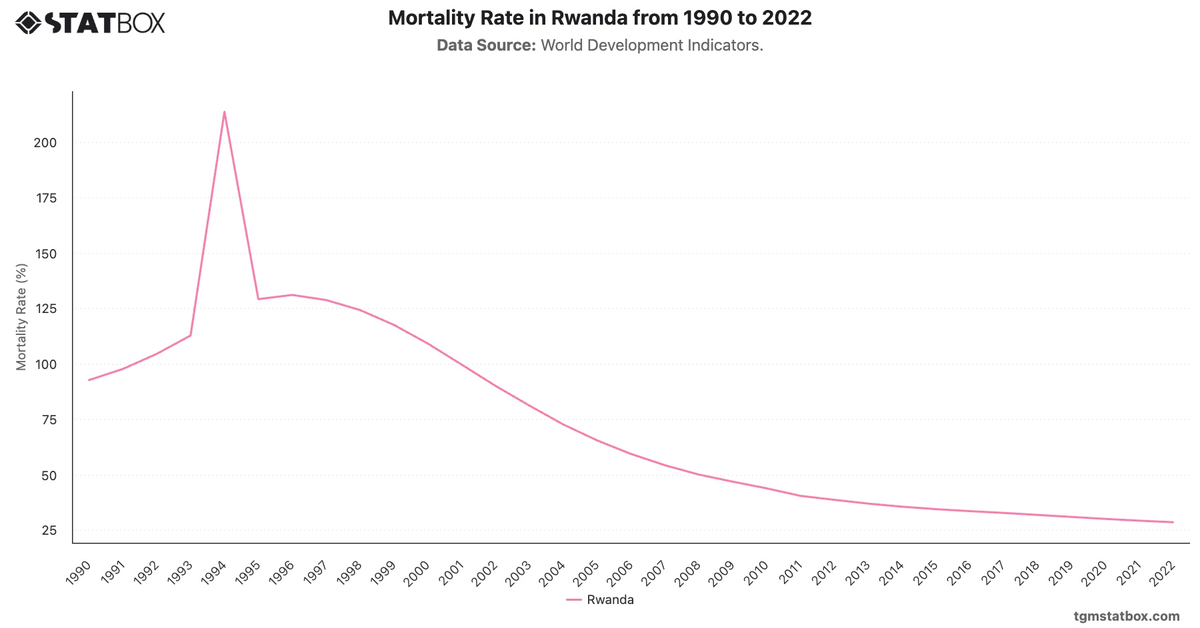
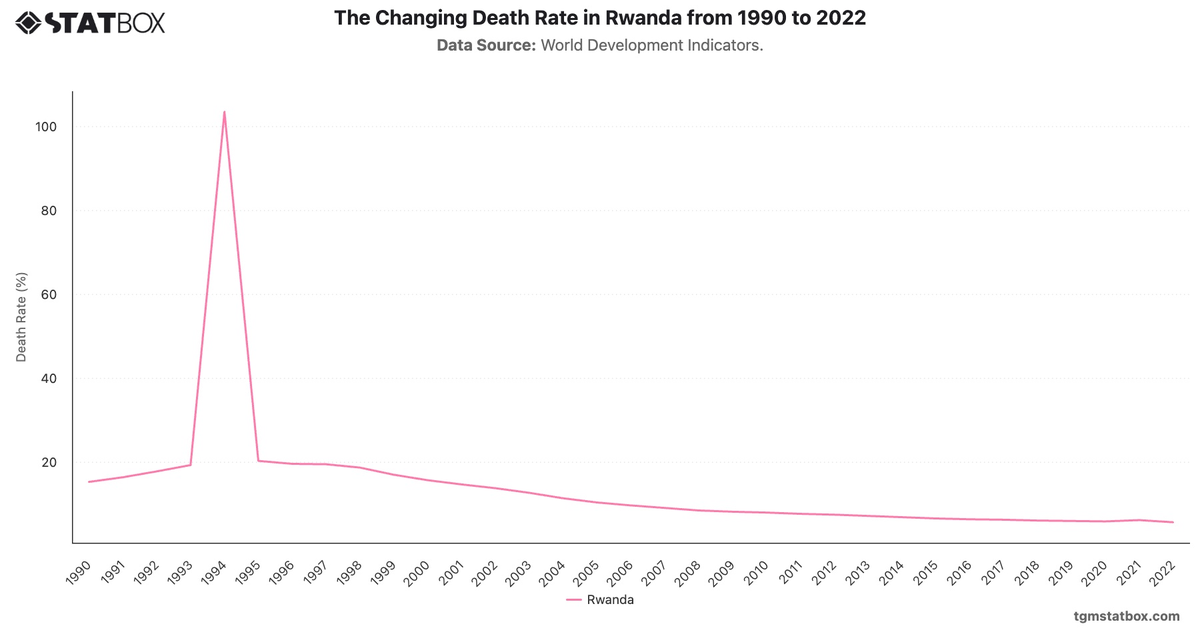
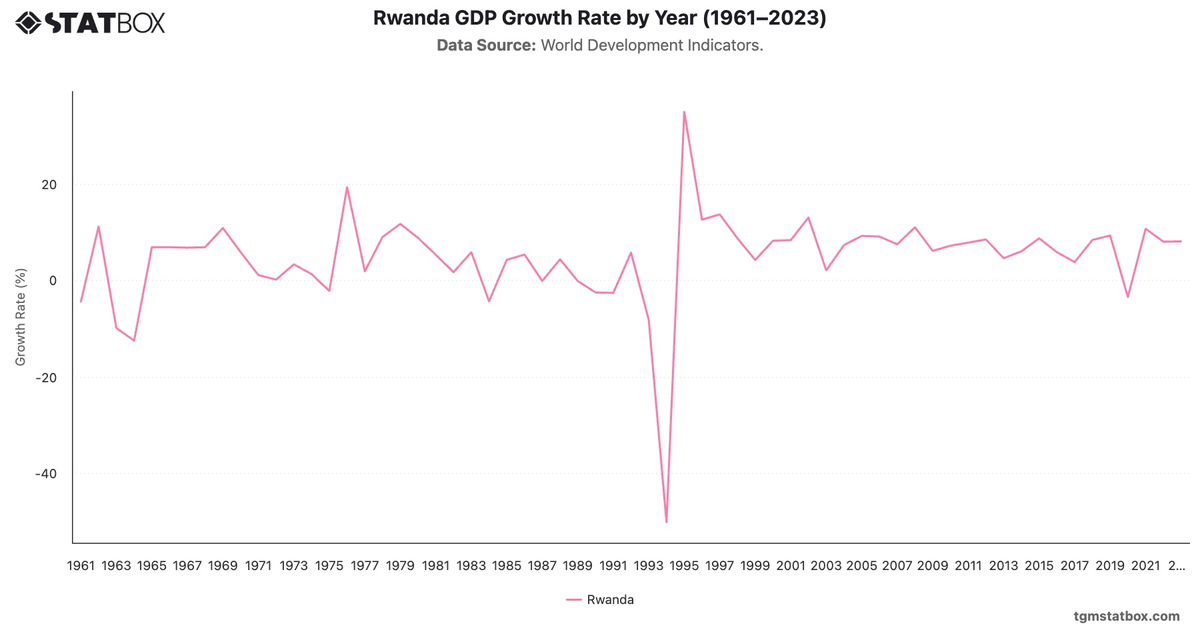
For a deeper dive into the topic, explore Rwanda’s mortality rate, Rwanda’s military spending, Rwanda’s annual GDP growth rate.

Further Recommended Statistics

Statbox vector
Statbox |form contact icon

Have Other Queries?

Statbox vector

Connect with our expert team for immediate assistance or comprehensive market analysis. We are always ready to support your business needs.