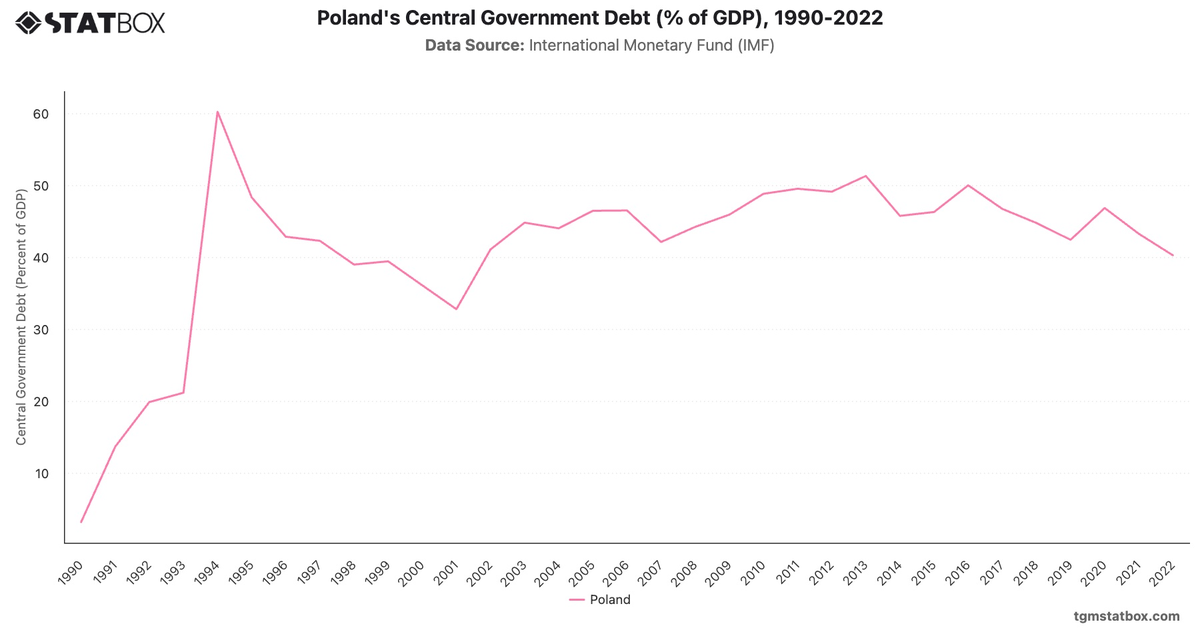
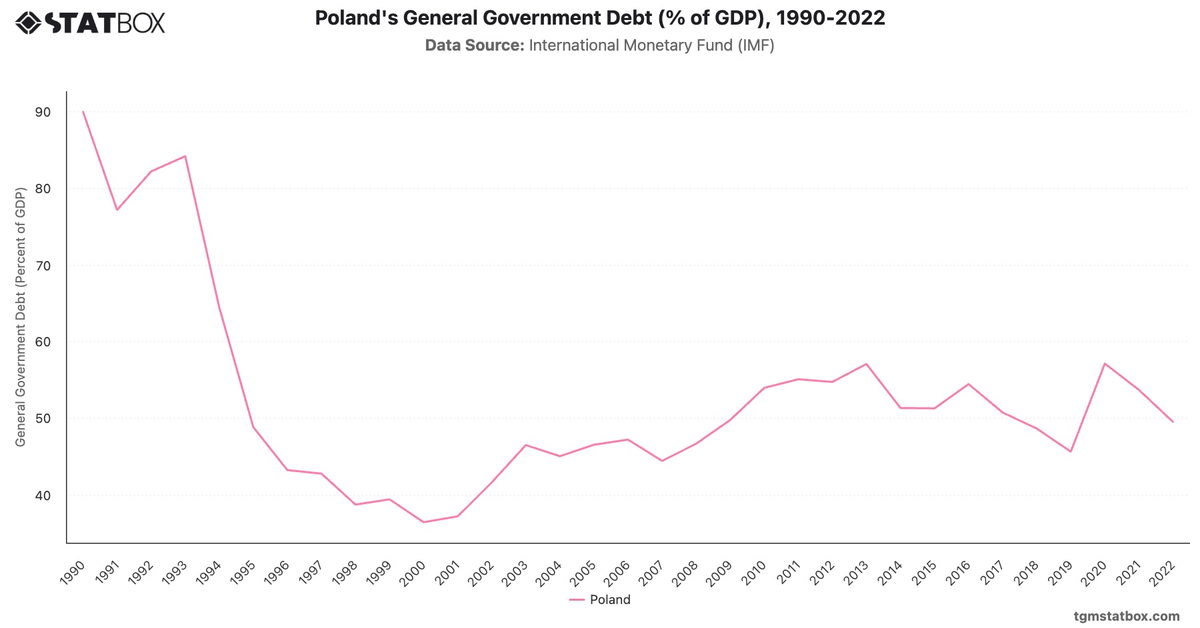
Poland’s fiscal trajectory reflects the impact of economic transitions and global crises. The early 2000s saw high deficits, peaking at -6.0% in 2003 due to public investment and structural reforms. Improvements followed, with deficits narrowing to -0.7% by 2019, supported by strong economic growth.
The COVID-19 pandemic reversed gains, with a deficit of -6.9% in 2020. Projections suggest stabilization around -4.1% by 2029, reflecting Poland’s efforts to balance fiscal responsibility with economic recovery.
The COVID-19 pandemic reversed gains, with a deficit of -6.9% in 2020. Projections suggest stabilization around -4.1% by 2029, reflecting Poland’s efforts to balance fiscal responsibility with economic recovery.
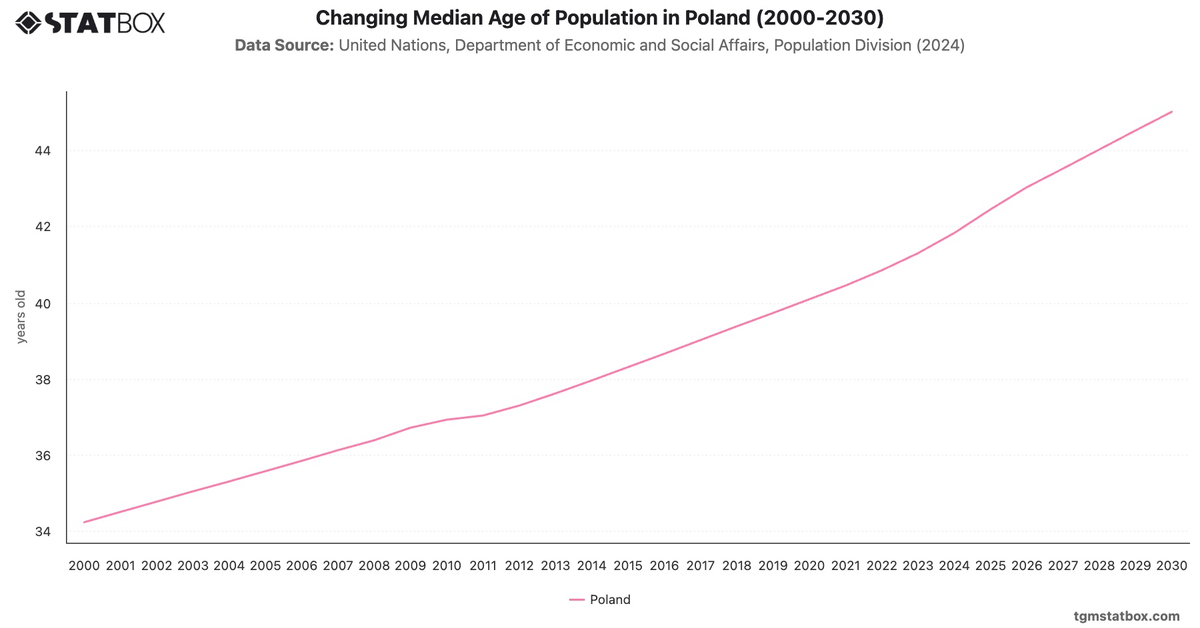
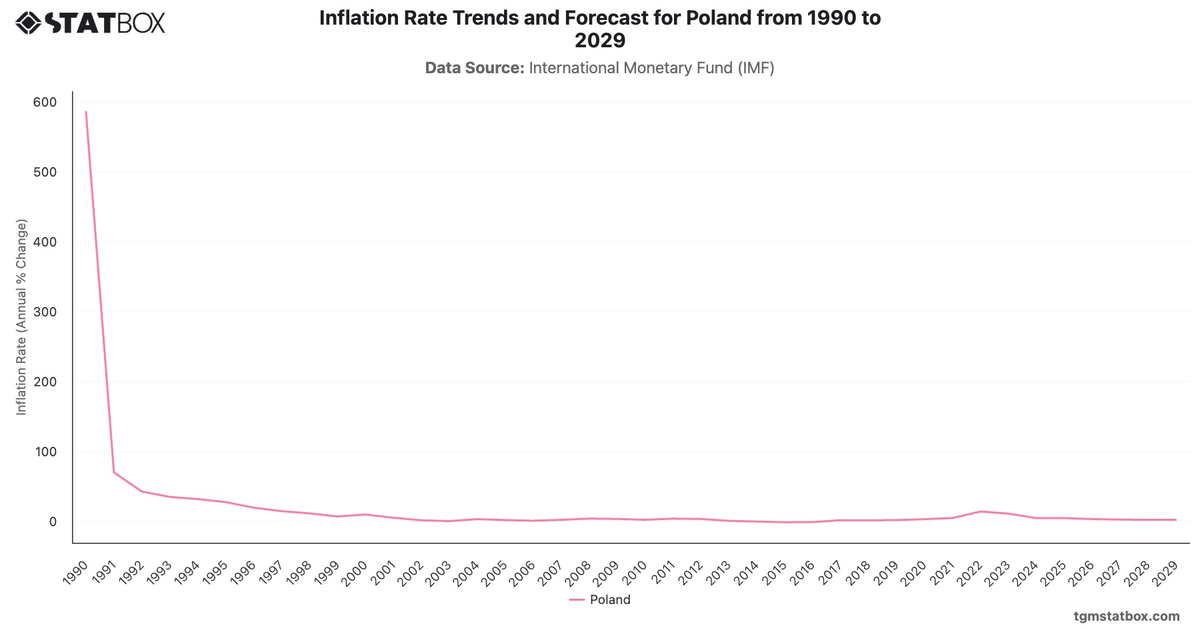
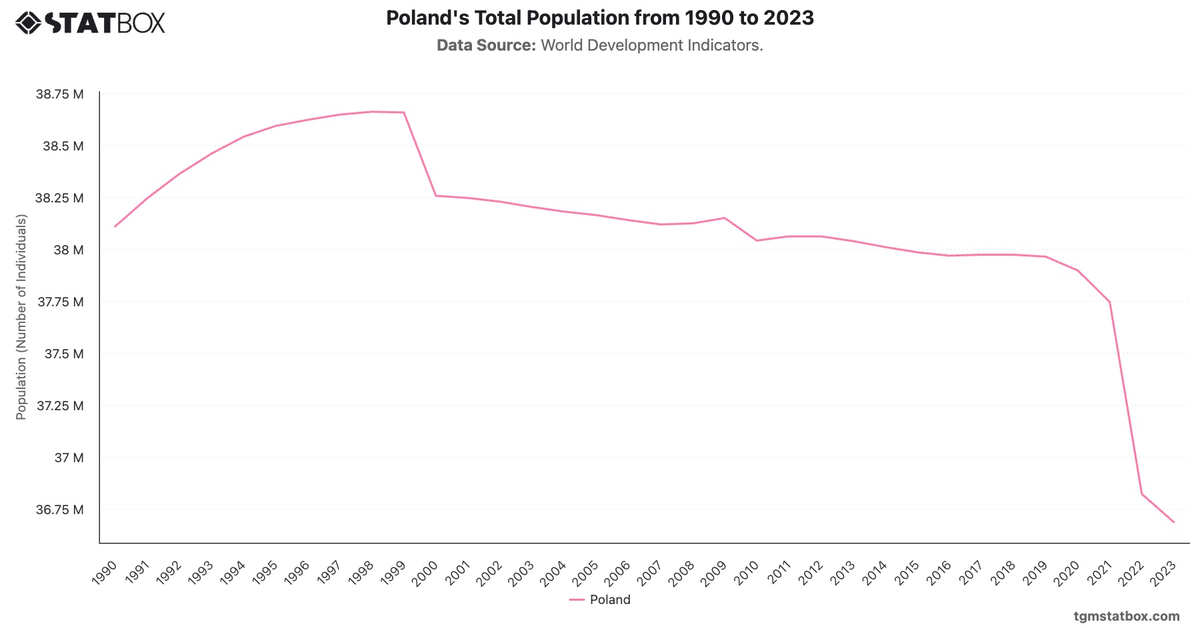
Gain a broader perspective by reviewing Poland’s shifting demographic age, Poland’s inflation rate trends, Poland’s demographic count.