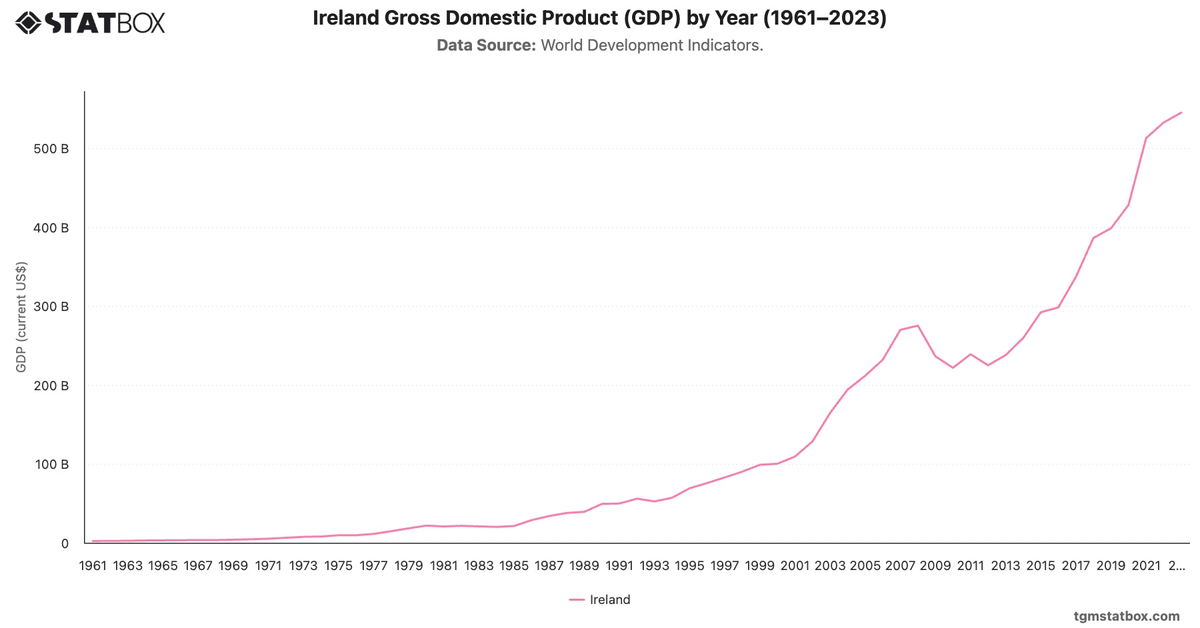
Ireland’s debt-to-GDP ratio declined significantly from 92.7% in 1990 to a low of 23.6% in 2006, reflecting the benefits of robust economic growth, known as the "Celtic Tiger" period. However, the 2008 global financial crisis and subsequent banking bailout led to a sharp increase, with debt levels peaking at 119.9% by 2013. During this period, Ireland's financial sector required substantial government support, impacting national debt heavily.
Following austerity measures and economic reforms, Ireland’s debt ratio saw a downward trend, reaching 57.0% in 2019. Despite a minor increase in 2020 due to COVID-19, the debt continued its decline, reaching 45.2% in 2022. Ireland's recovery showcases resilience, and its declining debt reflects strong fiscal management post-crisis, positioning it for sustainable growth moving forward.
Following austerity measures and economic reforms, Ireland’s debt ratio saw a downward trend, reaching 57.0% in 2019. Despite a minor increase in 2020 due to COVID-19, the debt continued its decline, reaching 45.2% in 2022. Ireland's recovery showcases resilience, and its declining debt reflects strong fiscal management post-crisis, positioning it for sustainable growth moving forward.
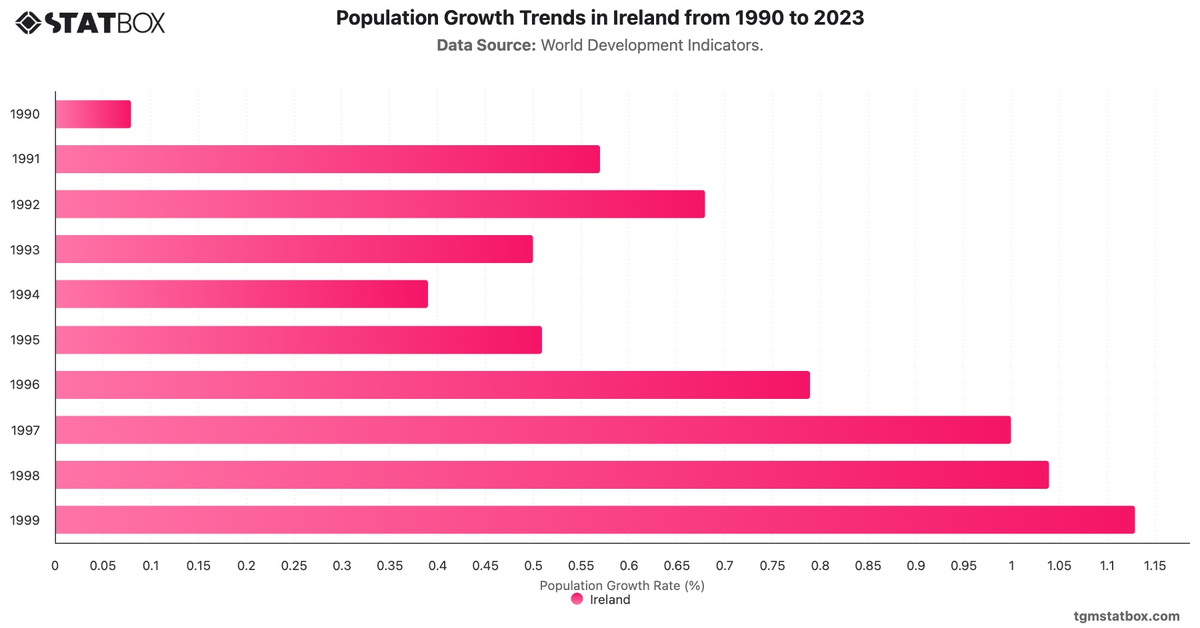
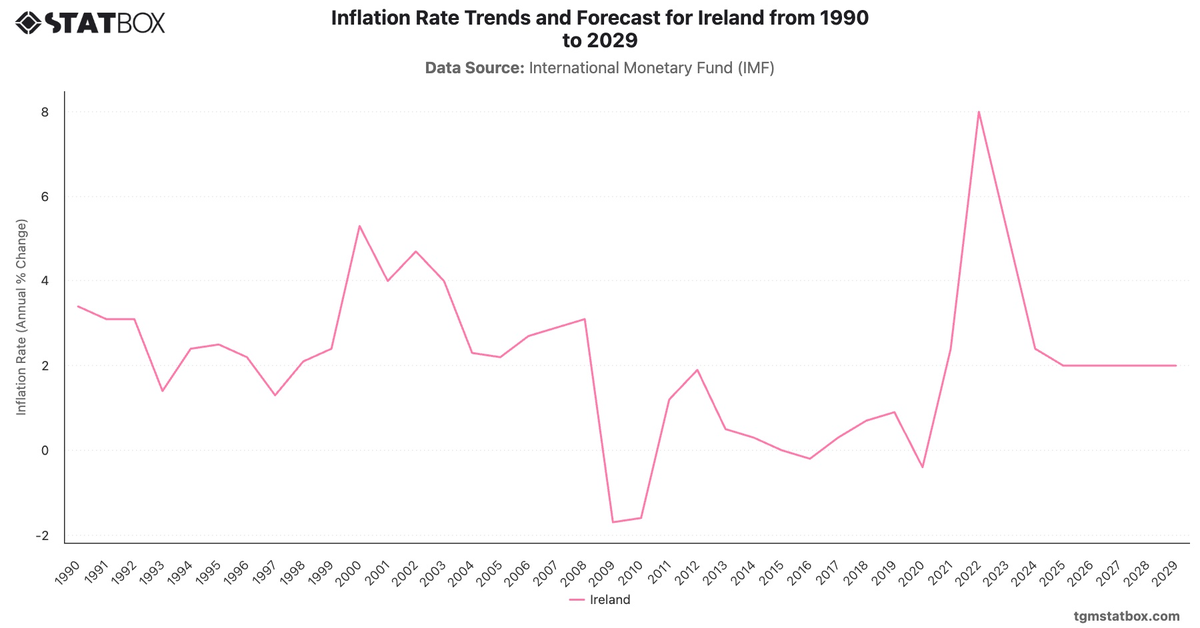
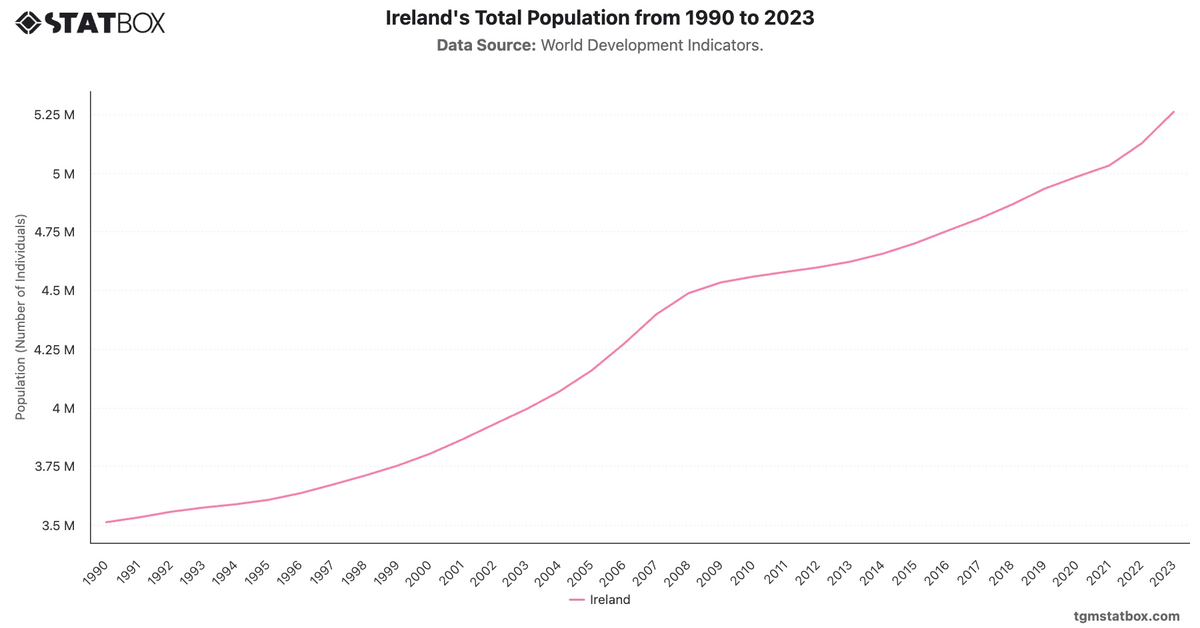
For a deeper dive into the topic, explore Ireland’s population growth trends, Ireland’s agriculture sector share in GDP, Ireland’s inflation rate trends.