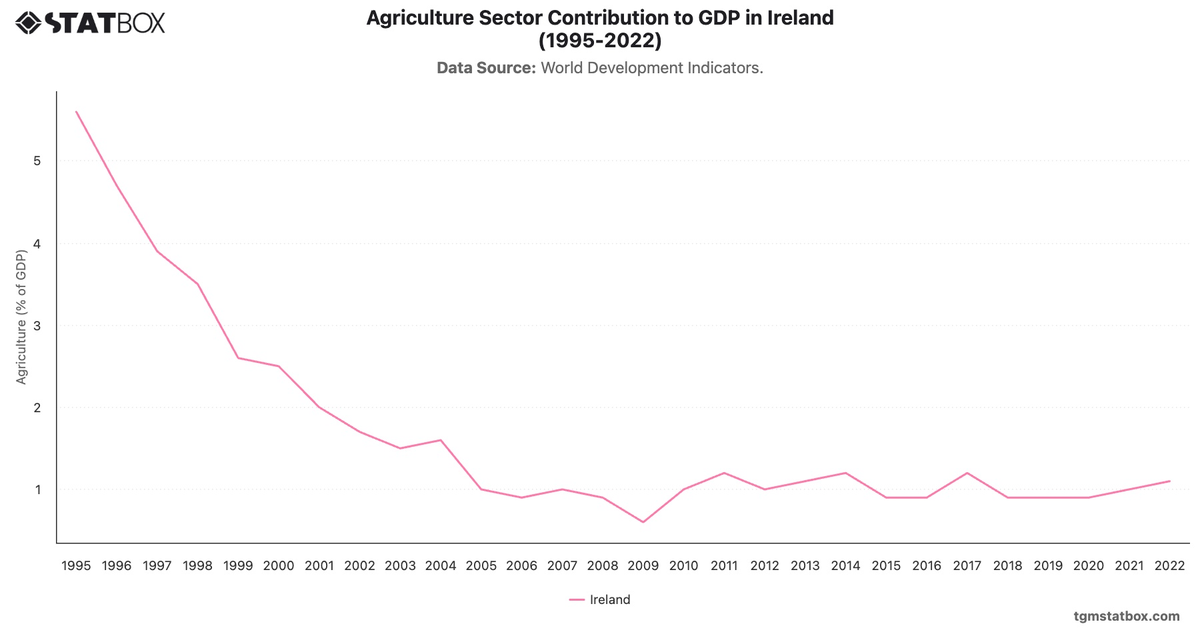
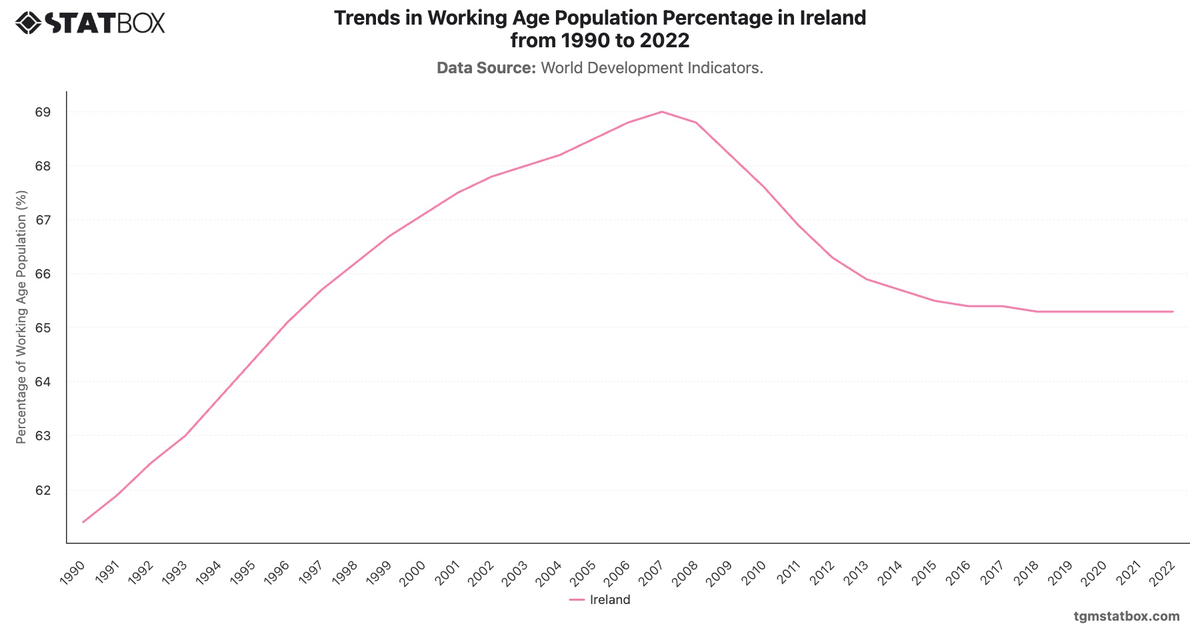
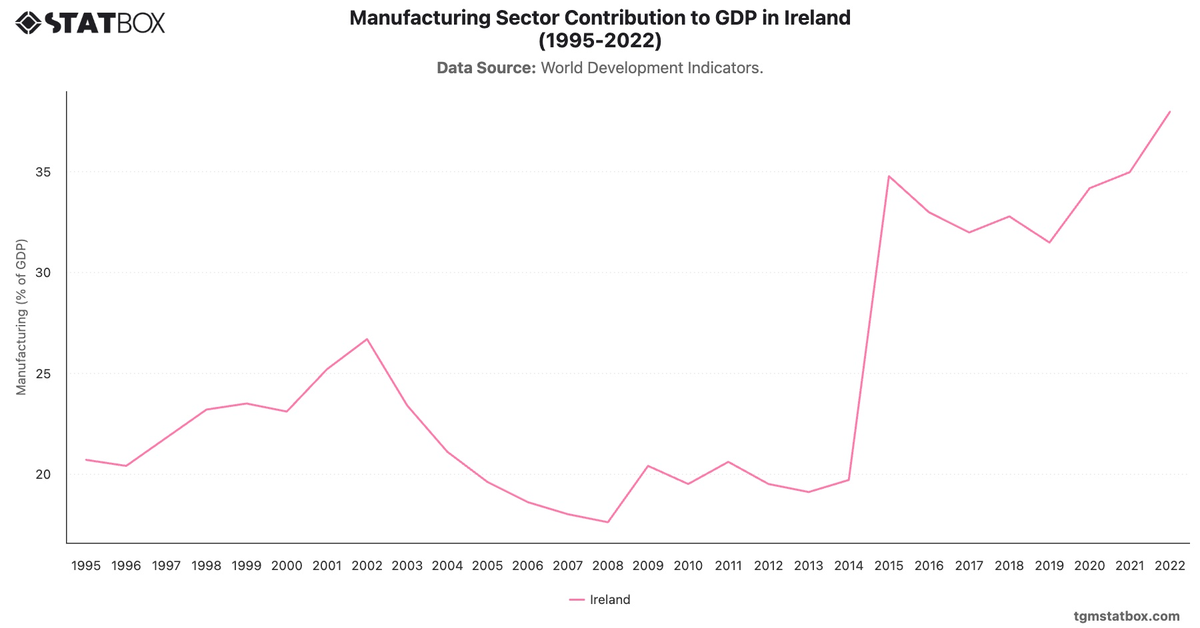
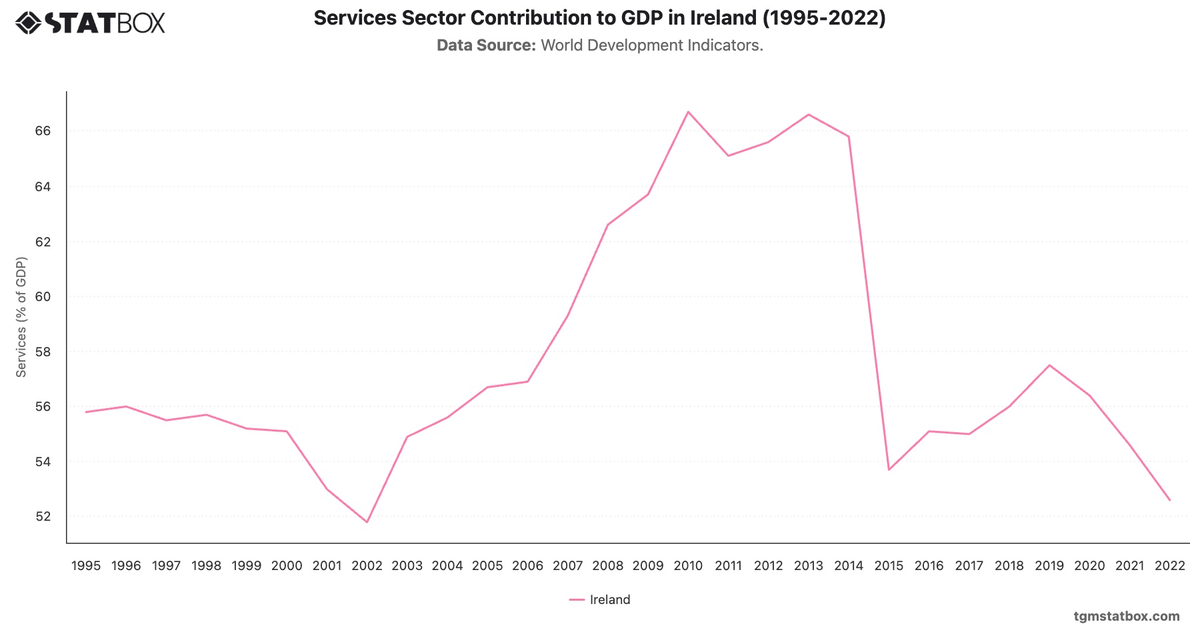
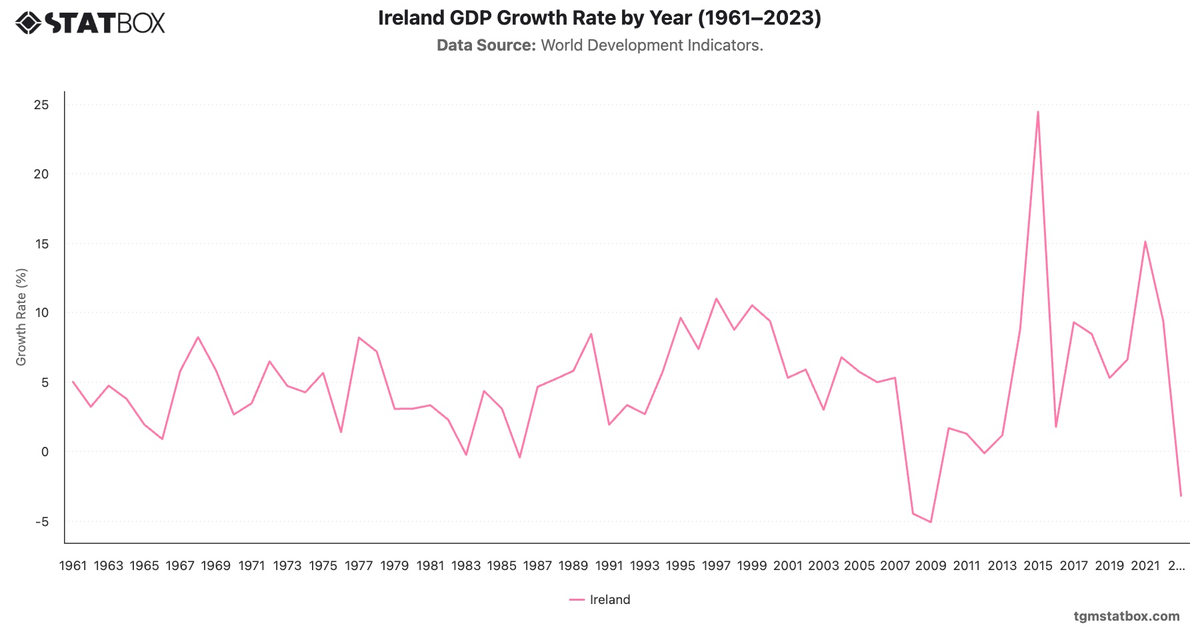
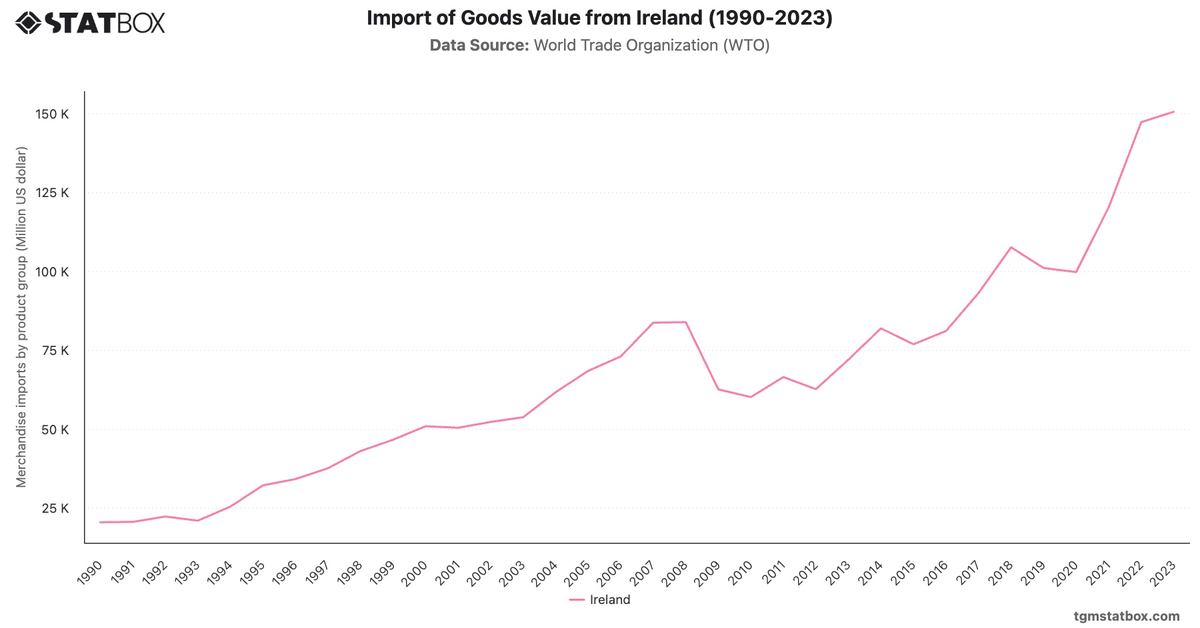
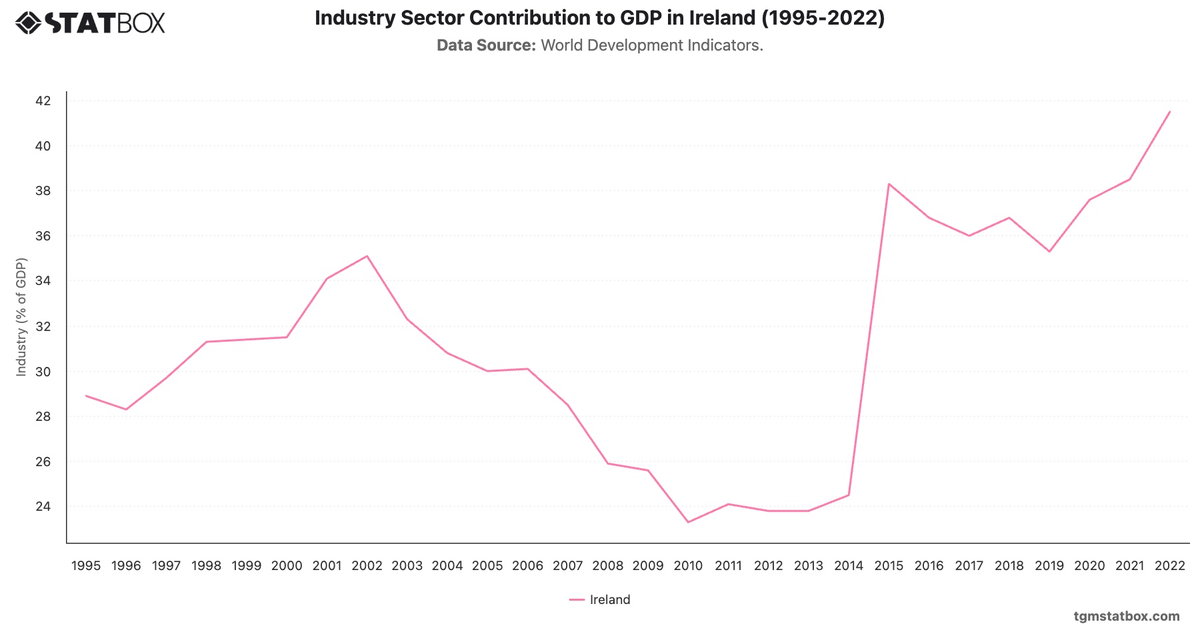
Ireland’s GDP reflects its transformation into a high-income economy driven by foreign investment and innovation. From $2.1 billion in 1961, GDP grew modestly until the 1990s. Economic reforms and EU membership catalyzed rapid growth, with GDP rising from $69.1 billion in 1995 to $270 billion in 2007.
The 2008 financial crisis caused a contraction, but Ireland’s recovery was robust, with GDP surpassing $500 billion in 2022. Its tech-driven economy and favorable corporate tax policies have sustained growth, making Ireland a leading hub for multinational companies.
The 2008 financial crisis caused a contraction, but Ireland’s recovery was robust, with GDP surpassing $500 billion in 2022. Its tech-driven economy and favorable corporate tax policies have sustained growth, making Ireland a leading hub for multinational companies.
Gain a broader perspective by reviewing Ireland’s unemployment trend, Ireland’s annual GDP growth rate, Ireland’s services sector share in GDP.