India's Net ODA (% of GNI) peaked at 1.0% in 1991, reflecting international support during its balance-of-payments crisis and economic liberalization reforms. Subsequent reductions indicate India’s growing self-reliance and economic expansion, with ODA stabilizing at minimal levels (0.1-0.2%) after 2000.
By the 2010s, India had transitioned to a regional power, reducing its reliance on ODA while emerging as a donor for smaller economies in South Asia. The consistent low levels of aid in recent years reflect its robust domestic capacity to fund development projects.
By the 2010s, India had transitioned to a regional power, reducing its reliance on ODA while emerging as a donor for smaller economies in South Asia. The consistent low levels of aid in recent years reflect its robust domestic capacity to fund development projects.
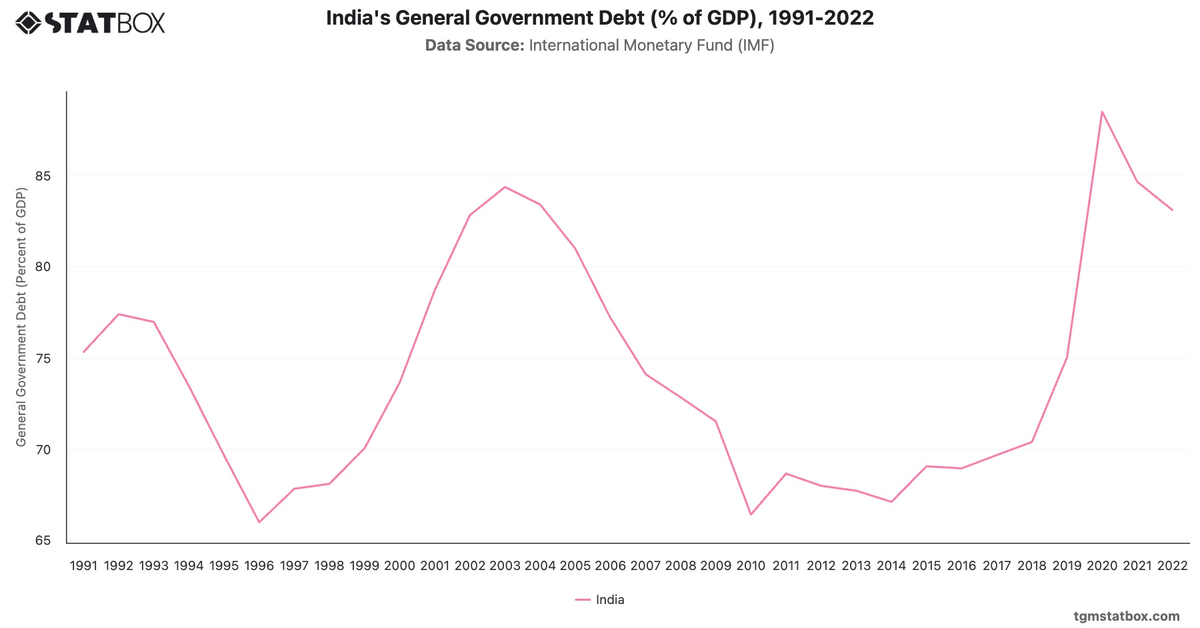
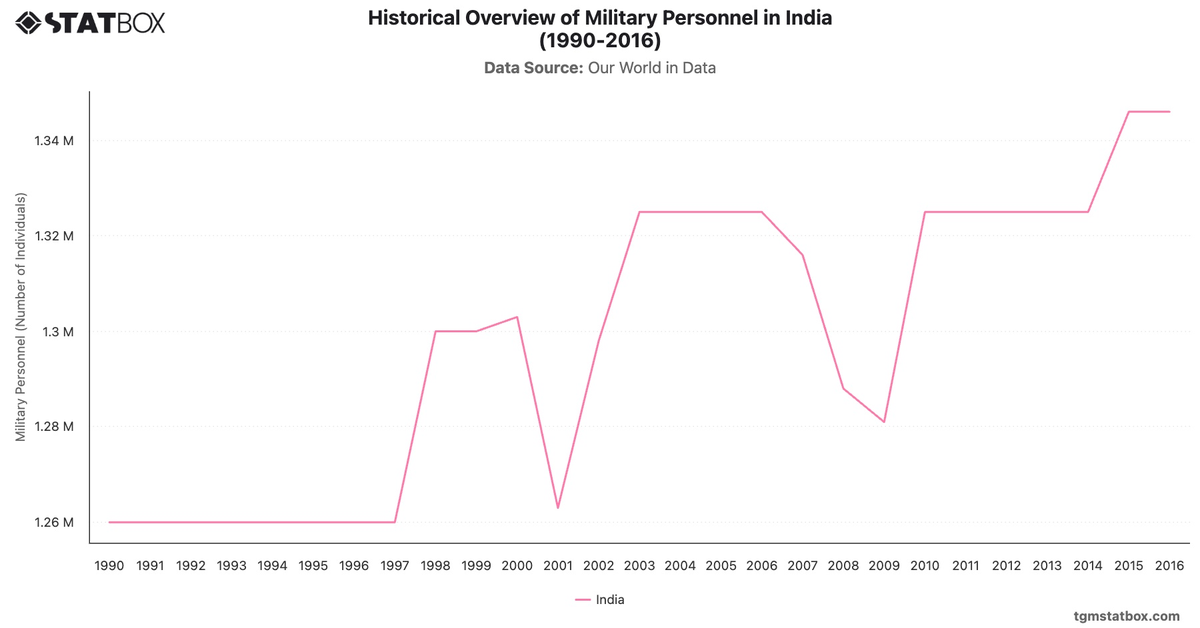
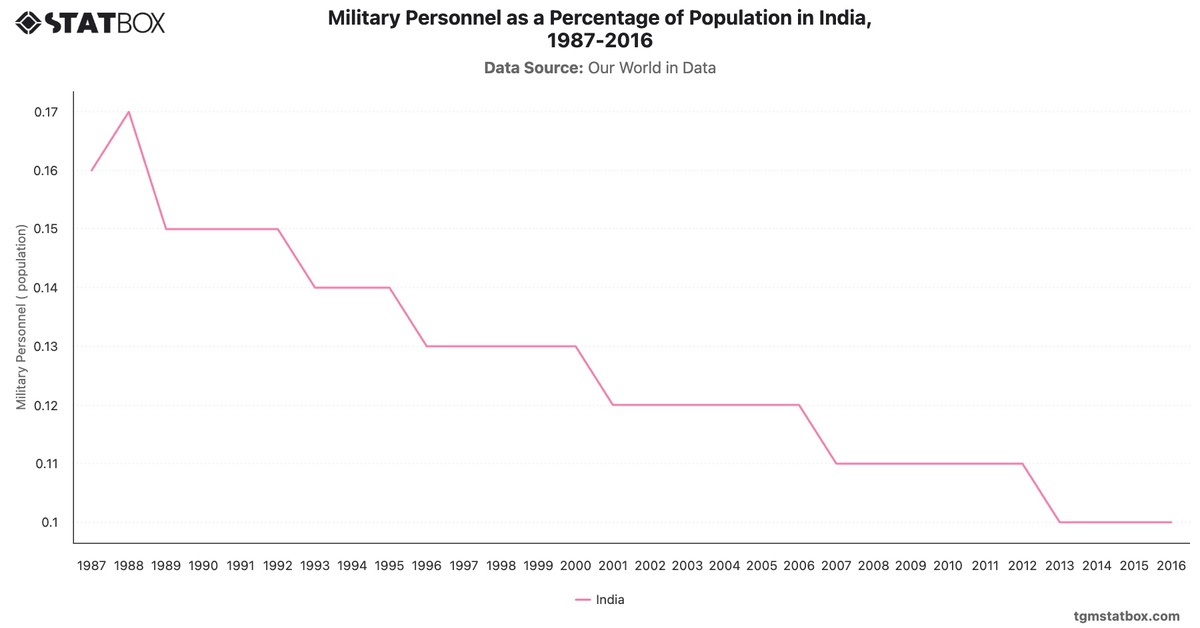
For a deeper dive into the topic, explore India’s government debt share in GDP, India’s net lending/borrowing as a percentage of GDP, India’s military personnel statistics.