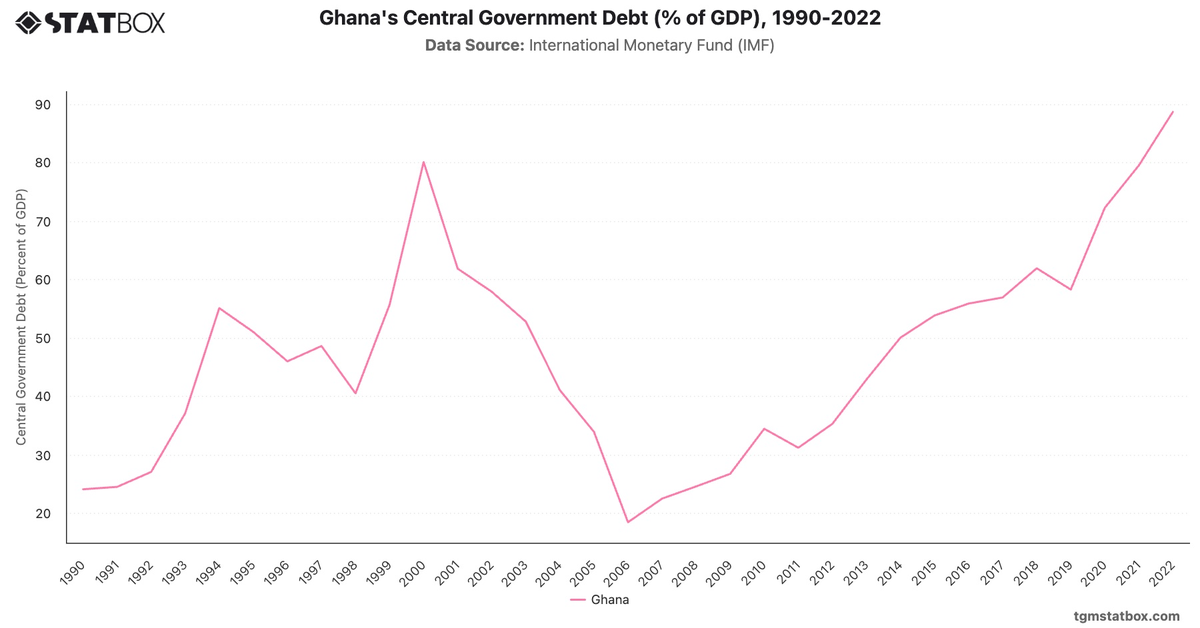
Ghana's fiscal performance reveals challenges in balancing growth and fiscal stability. The 1990s and 2000s saw persistent deficits averaging -5%, driven by public investments. The mid-2010s marked a deterioration, with deficits peaking at -17.4% in 2020 due to the pandemic's economic impact.
Recent recovery efforts reduced deficits to -4.6% by 2023, with stabilization expected around -3.4% by 2029. Continued reforms, including debt restructuring and improved revenue collection, are critical to sustaining fiscal health.
Recent recovery efforts reduced deficits to -4.6% by 2023, with stabilization expected around -3.4% by 2029. Continued reforms, including debt restructuring and improved revenue collection, are critical to sustaining fiscal health.
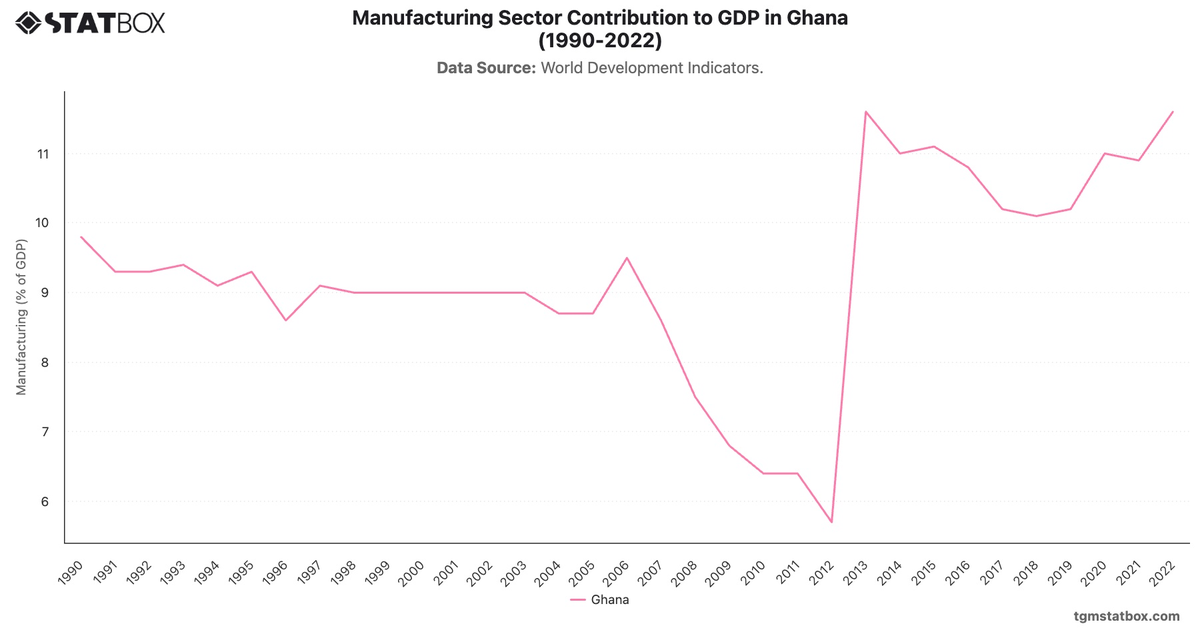
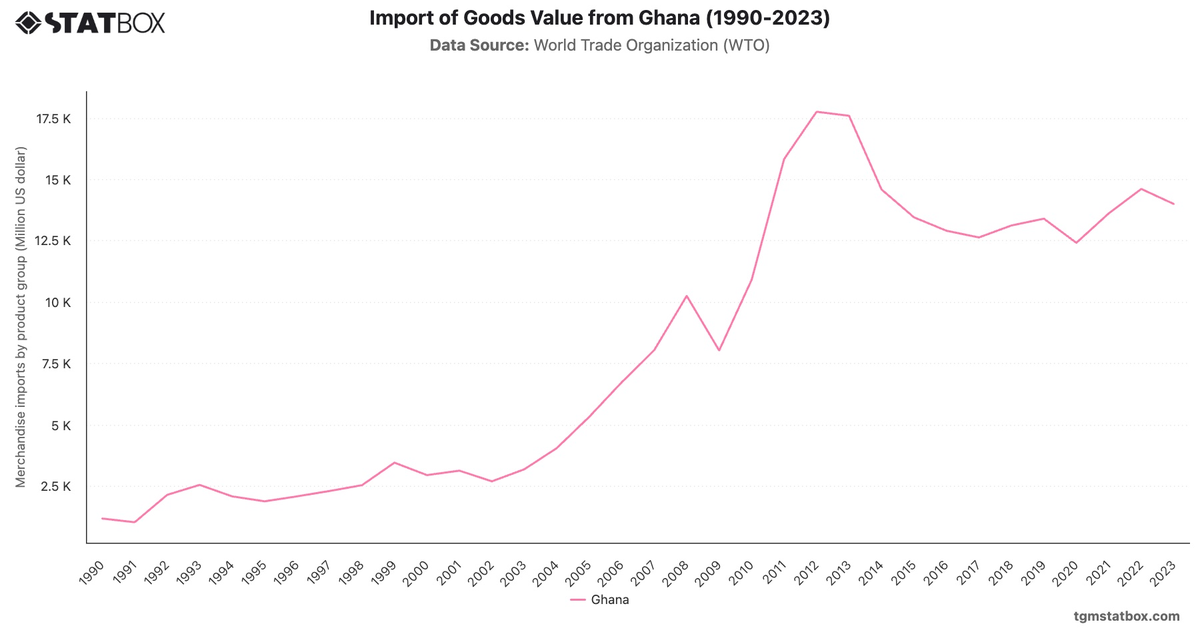
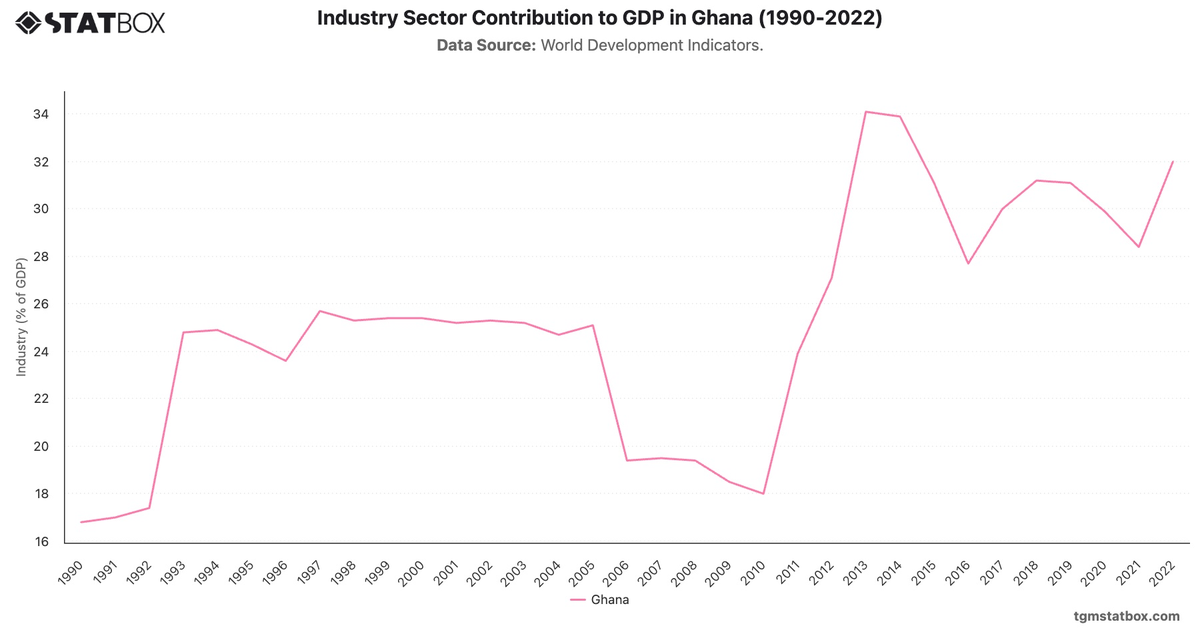
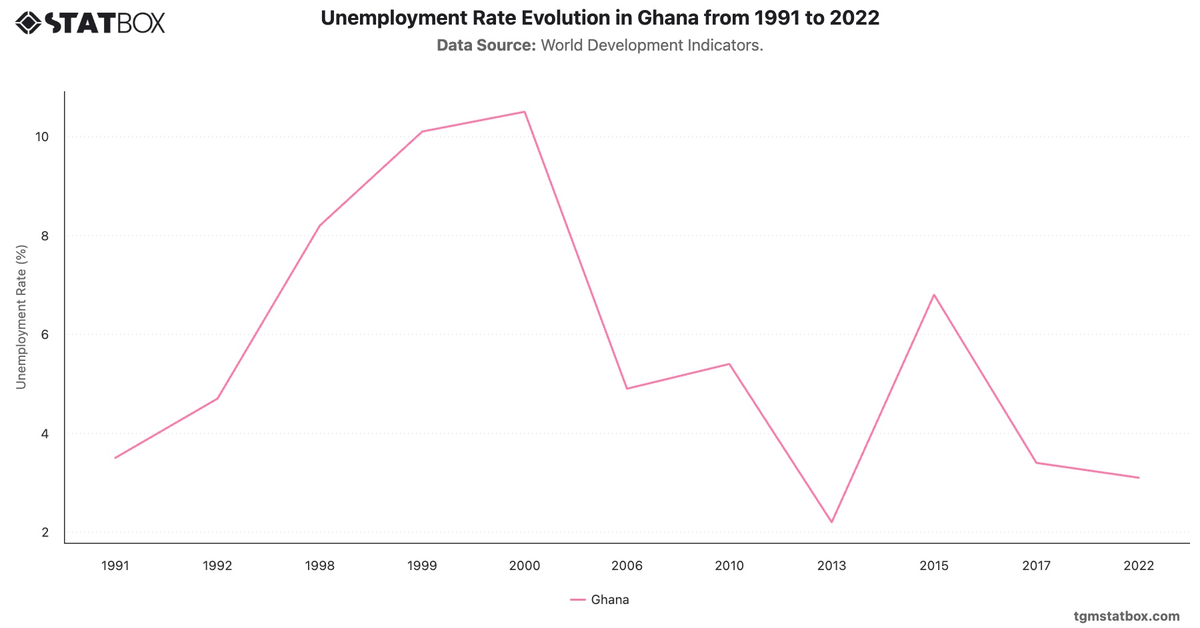
Discover additional trends and data on Ghana’s unemployment rate trend, Ghana’s goods imports, Ghana’s manufacturing sector share in GDP.