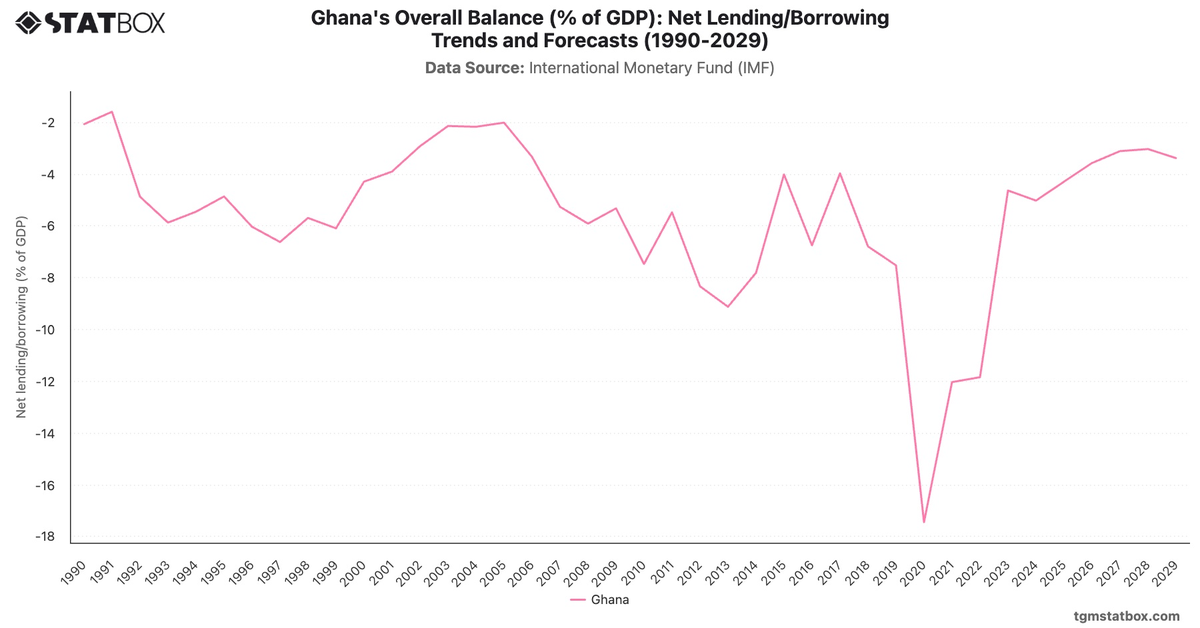
Ghana experienced significant volatility in central government debt from 1990 to 2022. Debt levels surged from 24.15% in 1990 to a peak of 80.17% in 2000, driven by structural adjustments and external borrowing. Debt relief initiatives in the mid-2000s reduced the burden, reaching a low of 18.51% in 2006.
However, rising fiscal deficits and external shocks led to a renewed increase, with debt climbing to 88.77% by 2022. The economic strain from the COVID-19 pandemic and currency depreciation contributed to this steep rise.
However, rising fiscal deficits and external shocks led to a renewed increase, with debt climbing to 88.77% by 2022. The economic strain from the COVID-19 pandemic and currency depreciation contributed to this steep rise.
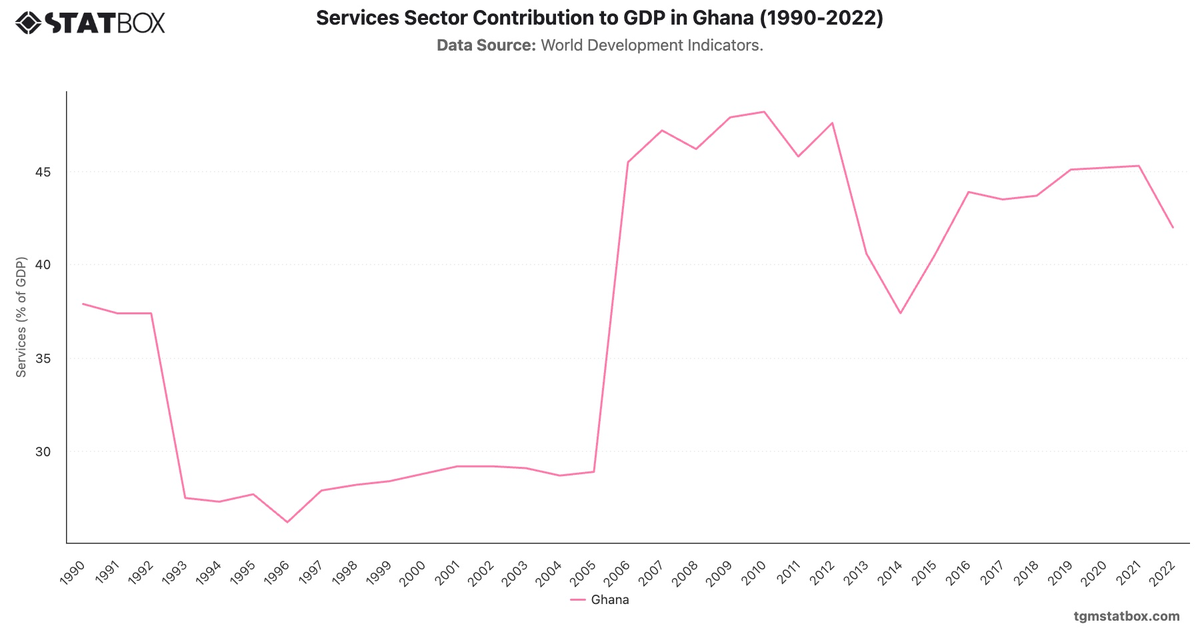
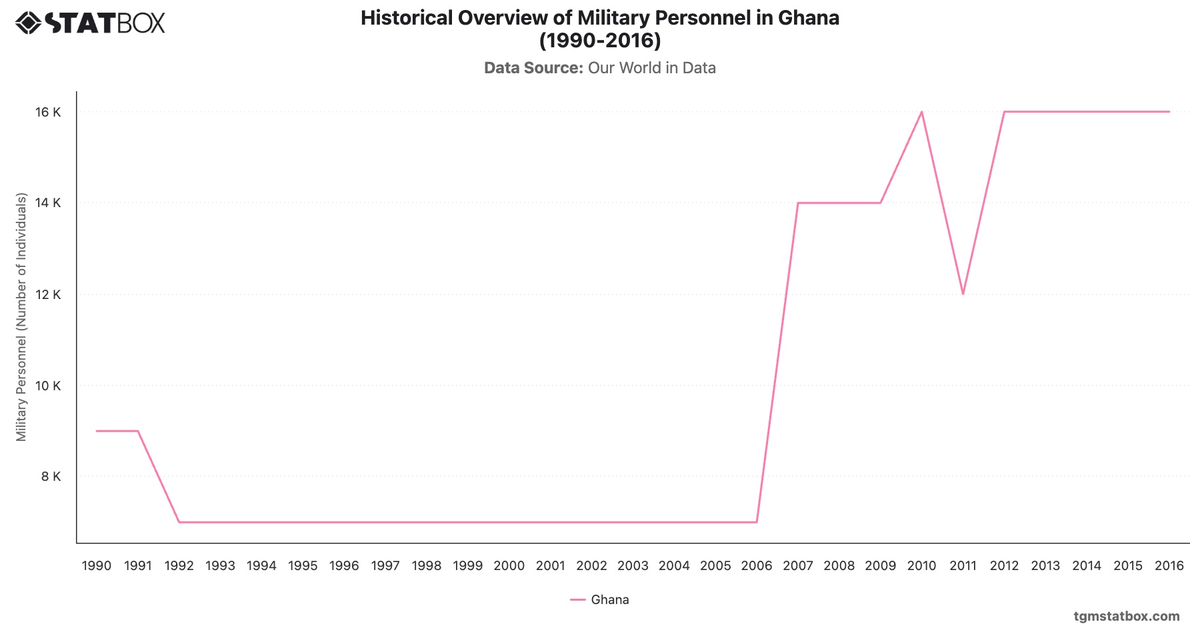
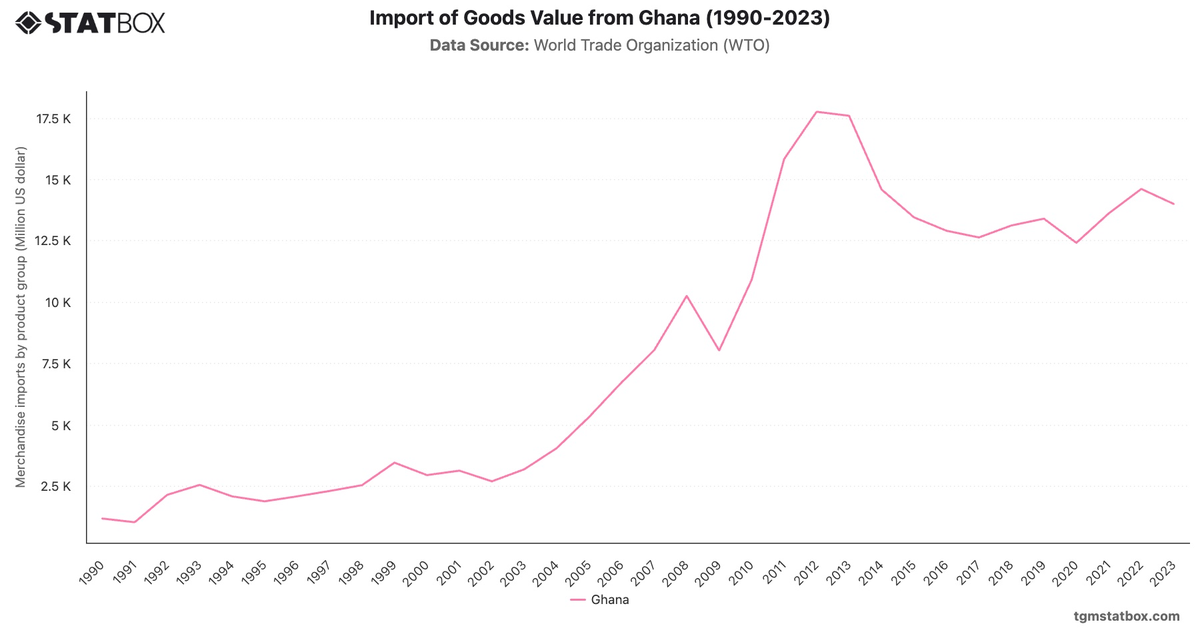
Explore related charts to gain a better understanding of Ghana’s services sector share in GDP, Ghana’s goods imports, Ghana’s military personnel history.