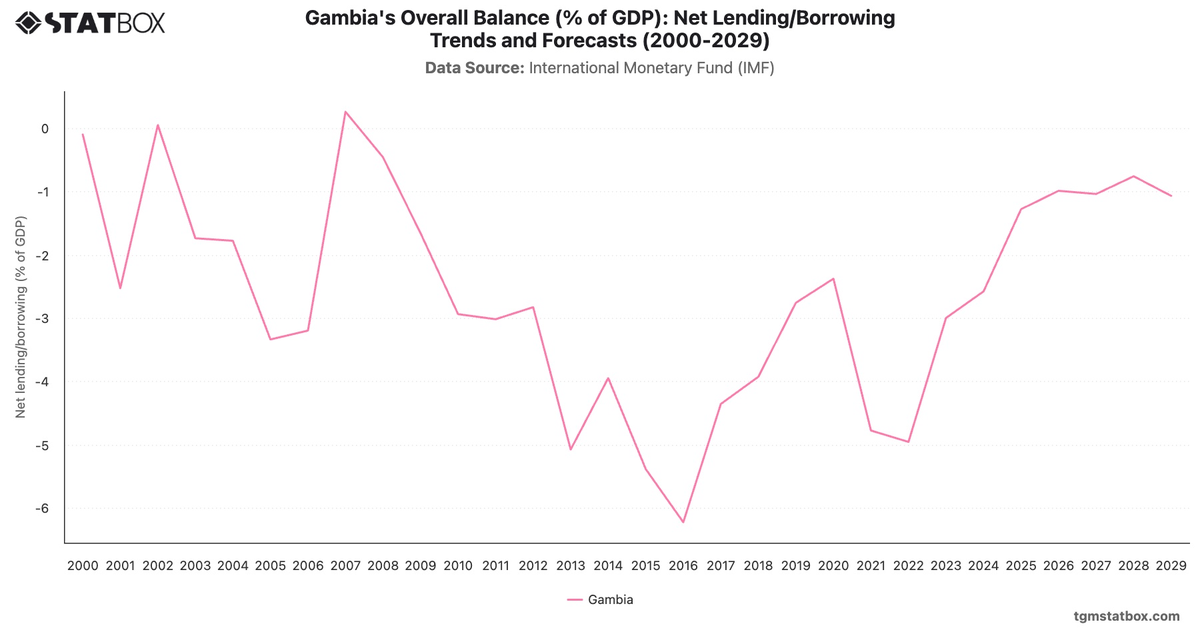
The Gambia’s central government debt fluctuated significantly, with peaks in 2002 at 93.88% due to fiscal mismanagement and external borrowing. A sharp reduction occurred in 2007, with debt dropping to 38.02%, attributed to debt relief under the HIPC Initiative.
However, rising public expenditures and external shocks led to another surge, with debt ratios exceeding 80% after 2016. By 2020, pandemic-related impacts further increased the ratio to 85.89%, with minimal improvement by 2022 when the debt remained high at 83.9%, highlighting persistent fiscal challenges.
However, rising public expenditures and external shocks led to another surge, with debt ratios exceeding 80% after 2016. By 2020, pandemic-related impacts further increased the ratio to 85.89%, with minimal improvement by 2022 when the debt remained high at 83.9%, highlighting persistent fiscal challenges.
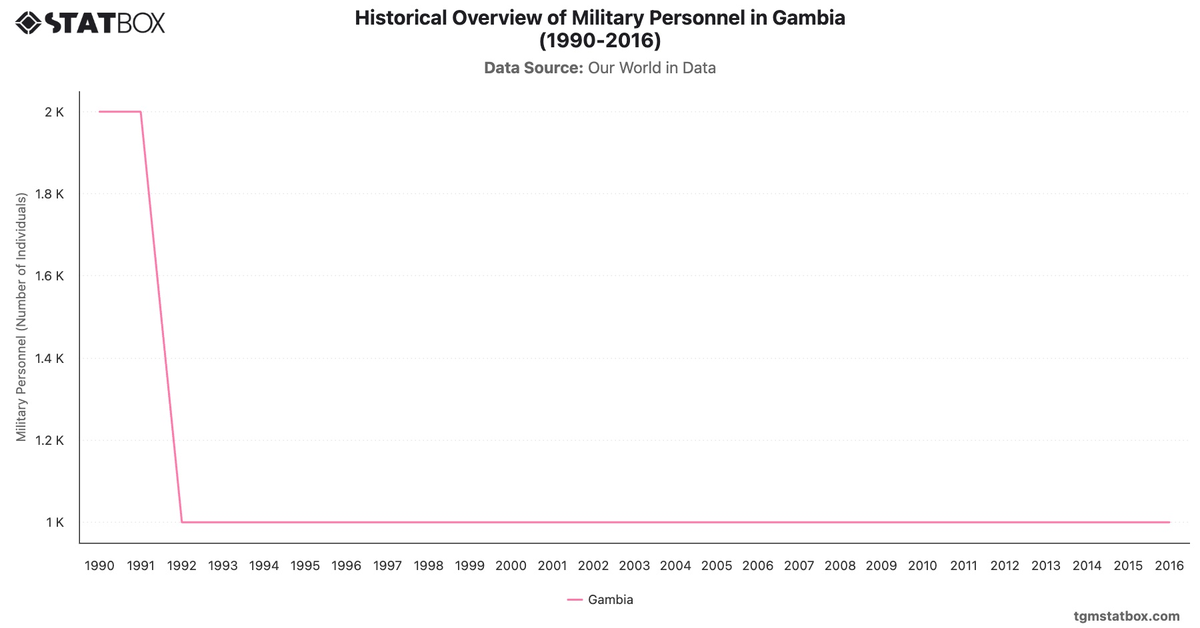
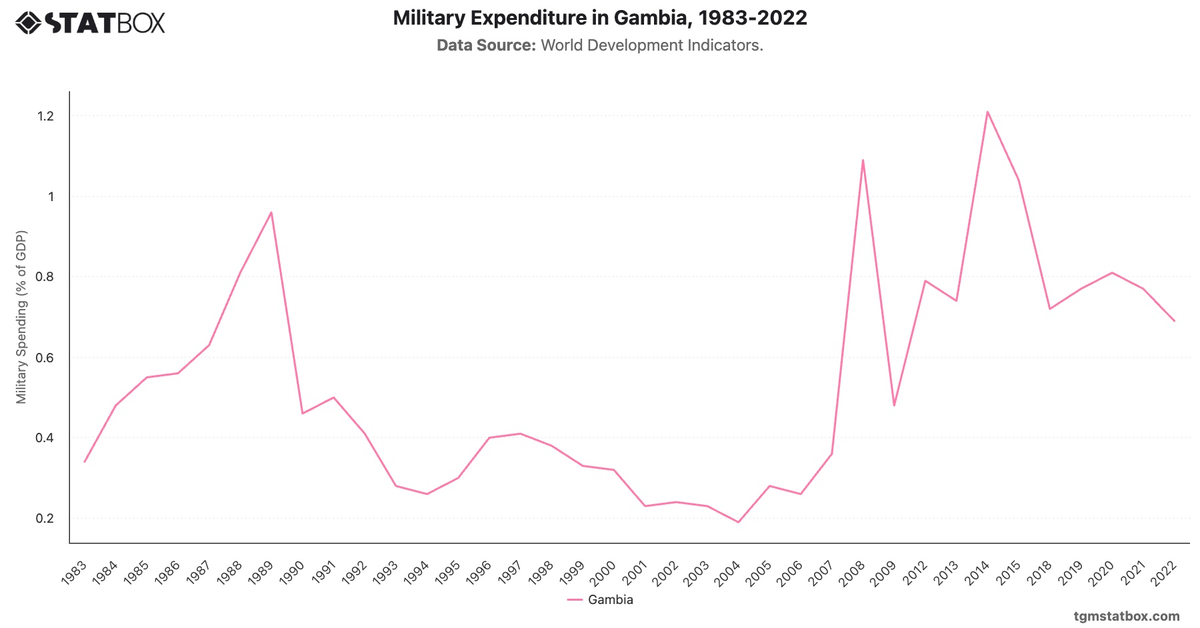
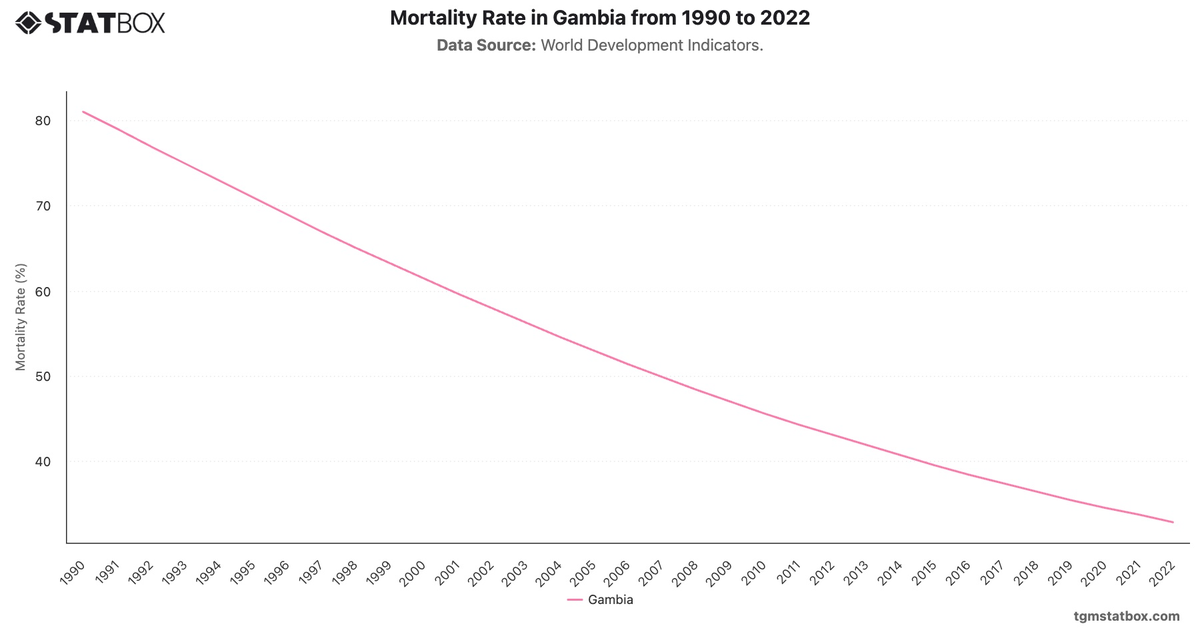
Gain a broader perspective by reviewing Gambia’s industry sector GDP share, Gambia’s military personnel overview, Gambia’s fluctuating mortality rate.