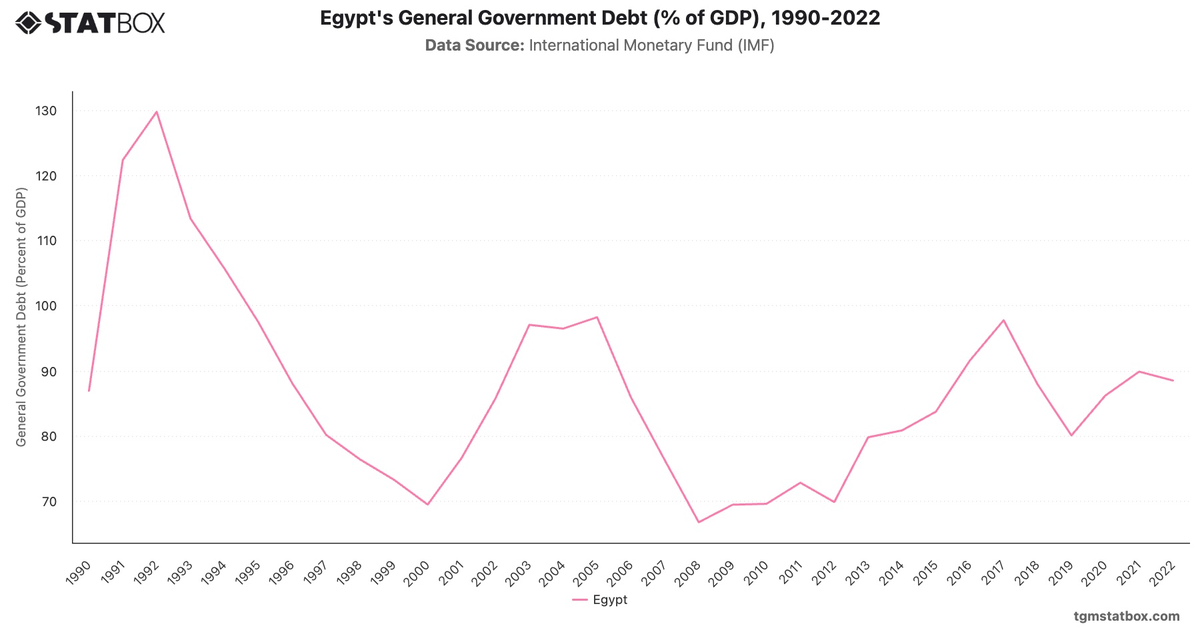
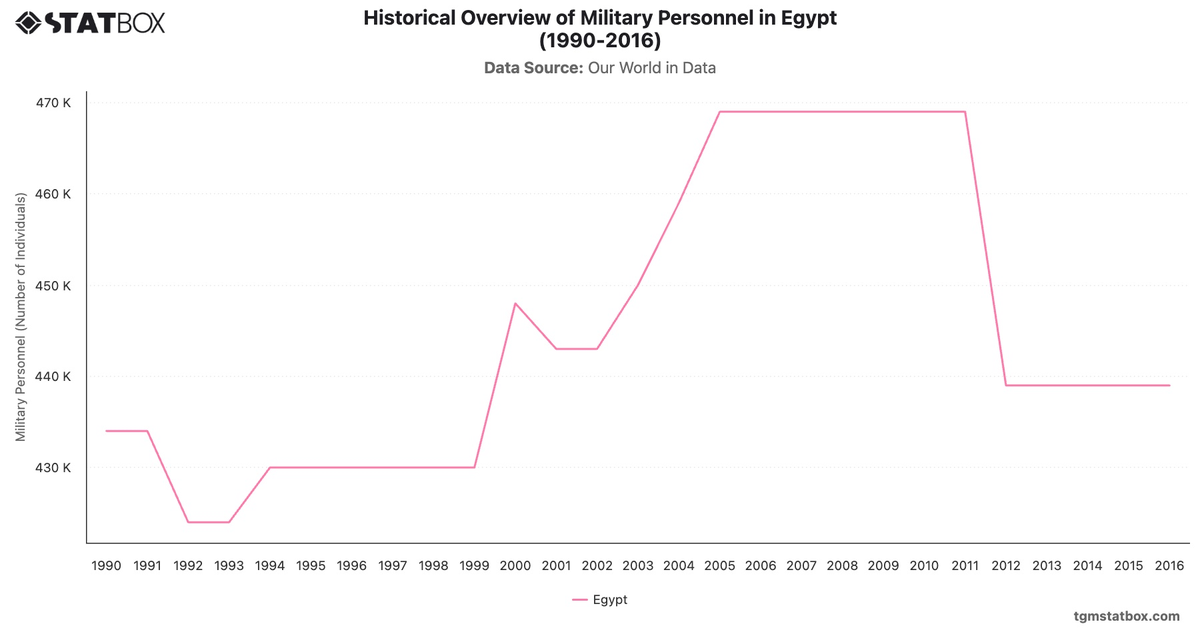
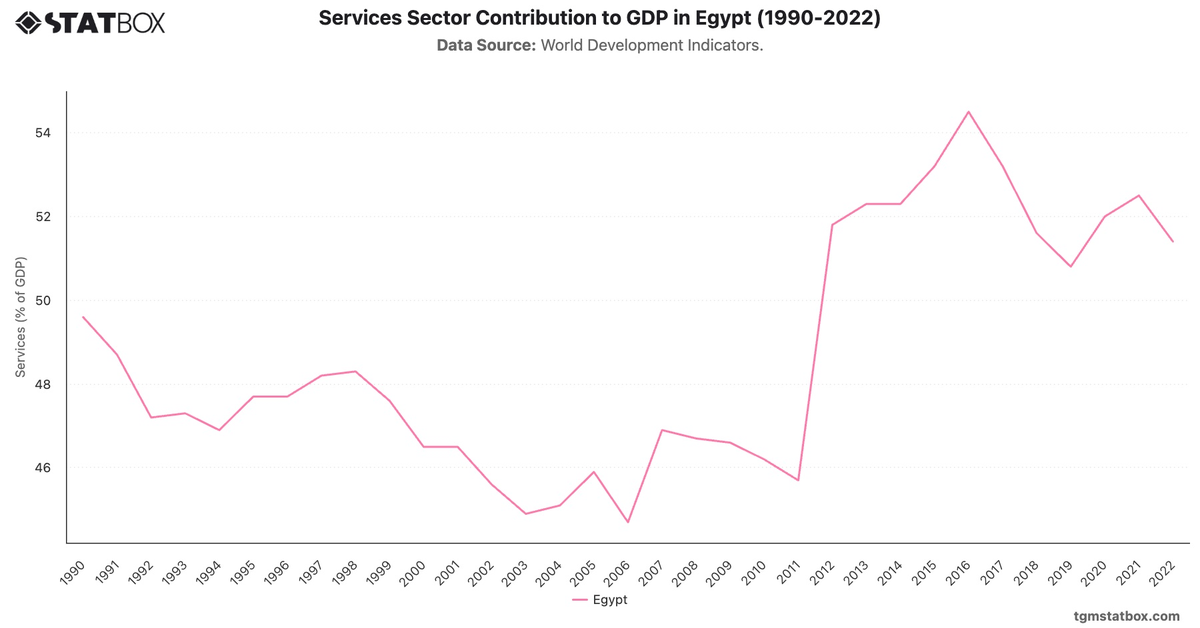
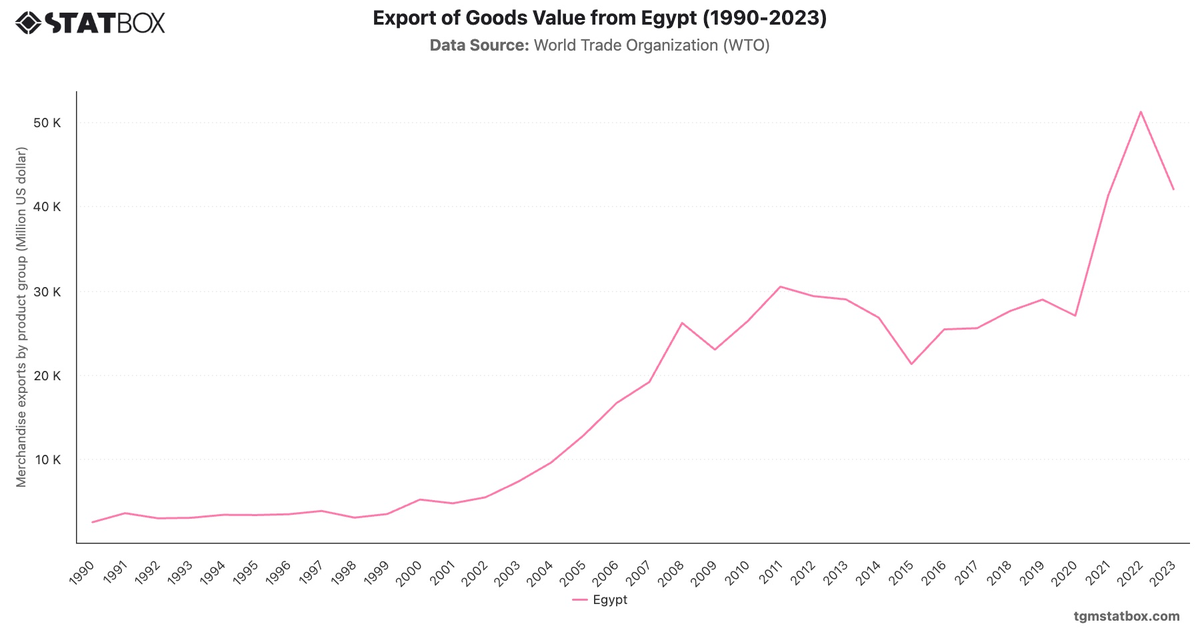
Egypt's Net ODA (% of GNI) saw a dramatic decline from 14.5% in 1990 to under 1% by 2010, reflecting reduced donor reliance as the country’s economy grew and diversified. The early 1990s spike was tied to debt forgiveness programs and major infrastructure projects. Renewed increases in 2013 and 2021, reaching 2.0% and 1.9%, respectively, align with political transitions and economic reform programs that drew donor support.
Overall, Egypt's ODA trends reflect its evolving needs, from heavy aid dependency in the 1990s to a more self-reliant but still strategically supported economy in recent years.
Overall, Egypt's ODA trends reflect its evolving needs, from heavy aid dependency in the 1990s to a more self-reliant but still strategically supported economy in recent years.
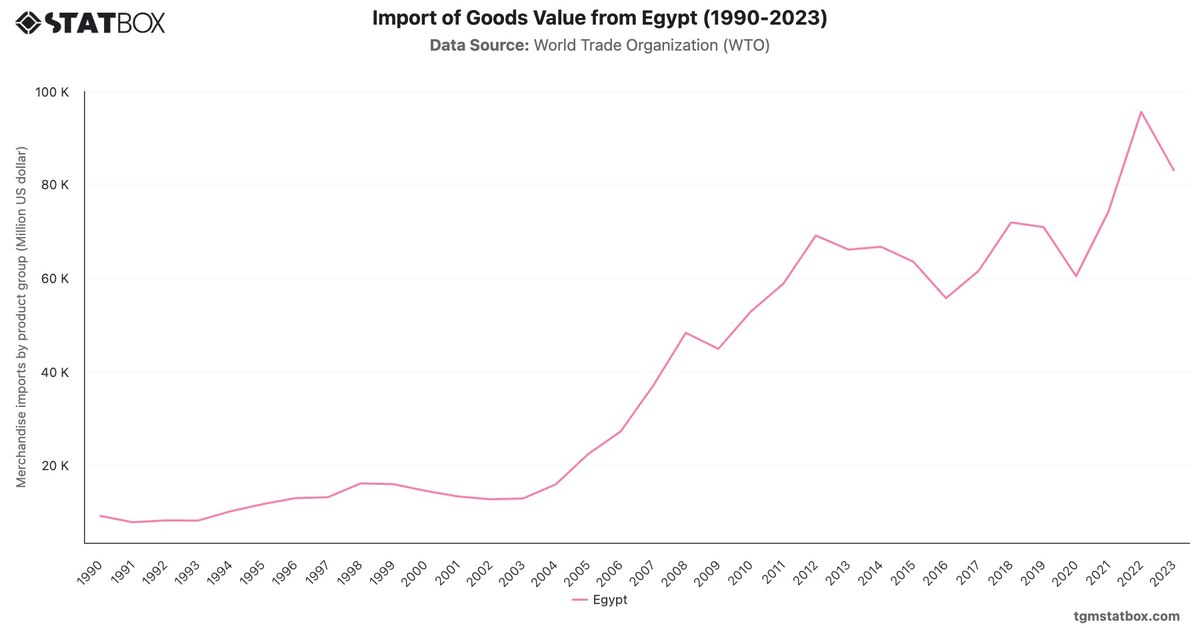
For additional information, visit statistics on Egypt’s population growth rate, Egypt’s goods import value, Egypt’s net lending/borrowing balance.