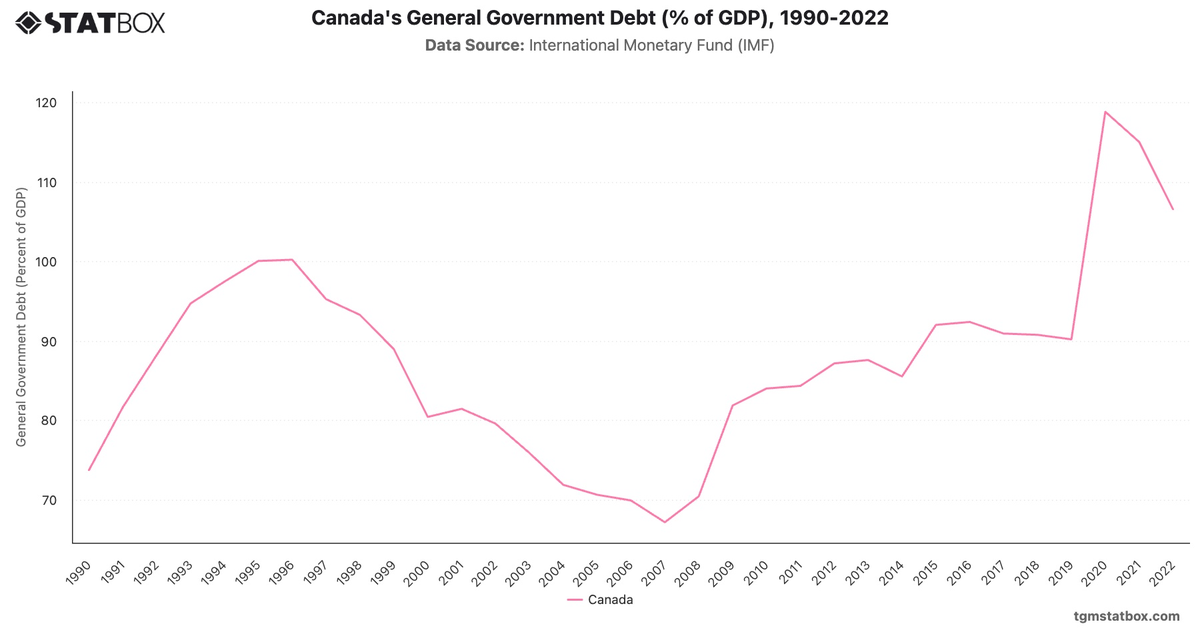
Canada’s fiscal trends demonstrate resilience and effective policy responses to crises. The 1990s saw deep deficits, peaking at -9.2% in 1992, as the government addressed structural fiscal imbalances. Significant reforms and strong economic growth resulted in surpluses by 1997, lasting through the early 2000s.
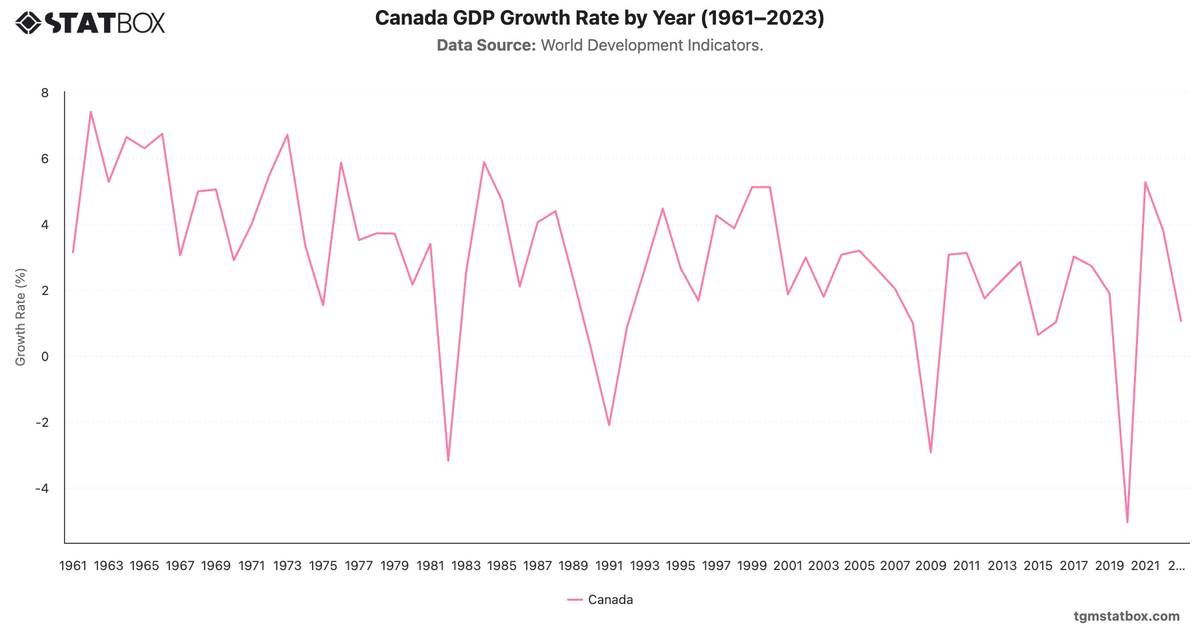
The 2008 financial crisis and the COVID-19 pandemic reversed these gains, with deficits reaching -10.9% in 2020. Recovery efforts have improved fiscal health, with the deficit narrowing to -0.4% by 2029, reflecting Canada’s strong economic fundamentals and prudent fiscal management.
The 2008 financial crisis and the COVID-19 pandemic reversed these gains, with deficits reaching -10.9% in 2020. Recovery efforts have improved fiscal health, with the deficit narrowing to -0.4% by 2029, reflecting Canada’s strong economic fundamentals and prudent fiscal management.
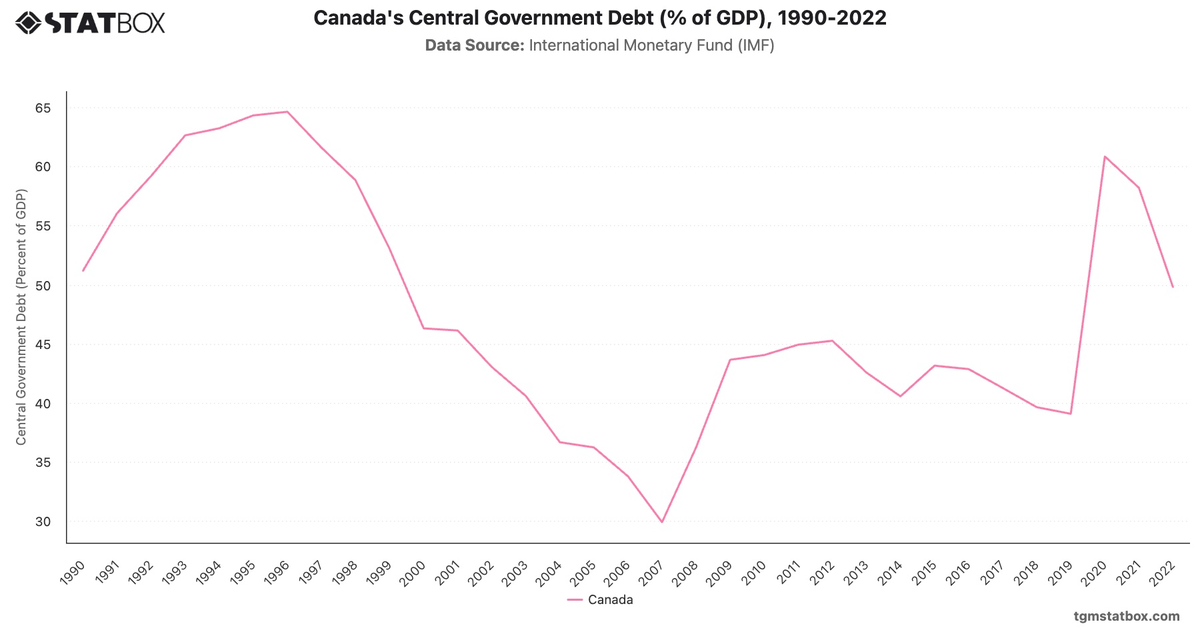
Discover additional trends and data on Canada’s central government debt-to-GDP ratio, Canada’s public debt as a share of GDP, Canada’s population density.