Belgium, a key hub for European trade, demonstrated steady import growth from $164.8B in 1999 to $466.3B in 2008, supported by its position as a logistics and trade center within the EU. The 2009 dip to $353.3B reflects the global financial crisis's impact. However, recovery was swift, with imports reaching $466.9B by 2011, highlighting resilience and robust trade partnerships.
By 2022, imports soared to $613.8B, driven by rising energy prices and increased demand for industrial goods. The slight decline to $548B in 2023 reflects stabilization post-pandemic and shifts in global supply chains. Belgium’s import trajectory underscores its economic integration, particularly in sectors like chemicals, machinery, and energy.
By 2022, imports soared to $613.8B, driven by rising energy prices and increased demand for industrial goods. The slight decline to $548B in 2023 reflects stabilization post-pandemic and shifts in global supply chains. Belgium’s import trajectory underscores its economic integration, particularly in sectors like chemicals, machinery, and energy.
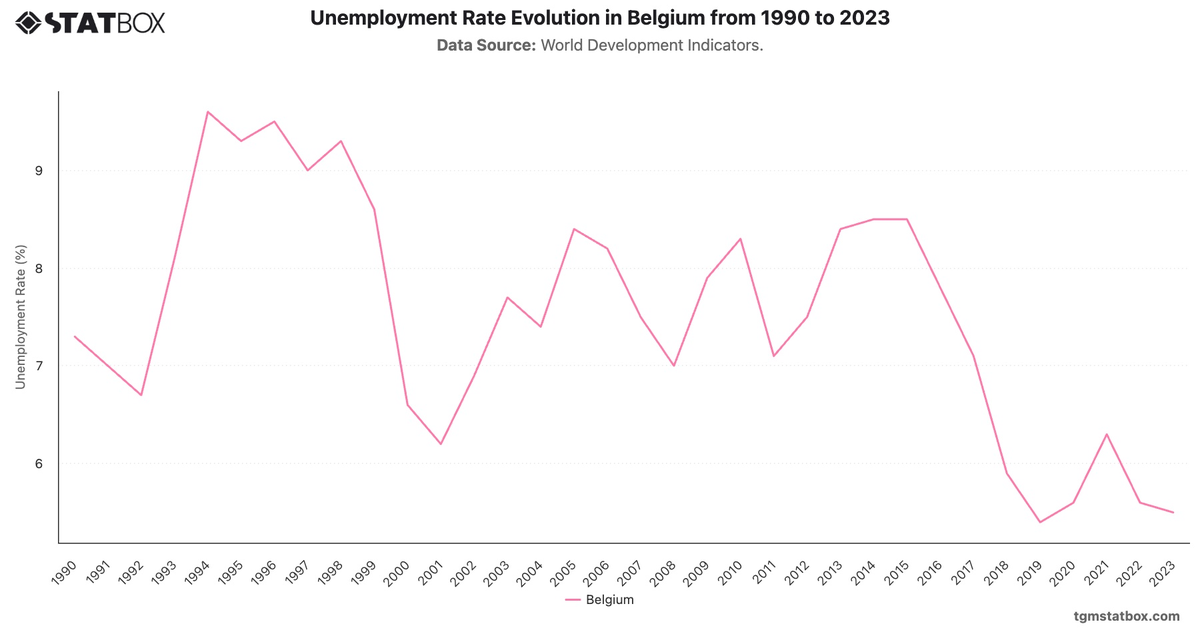
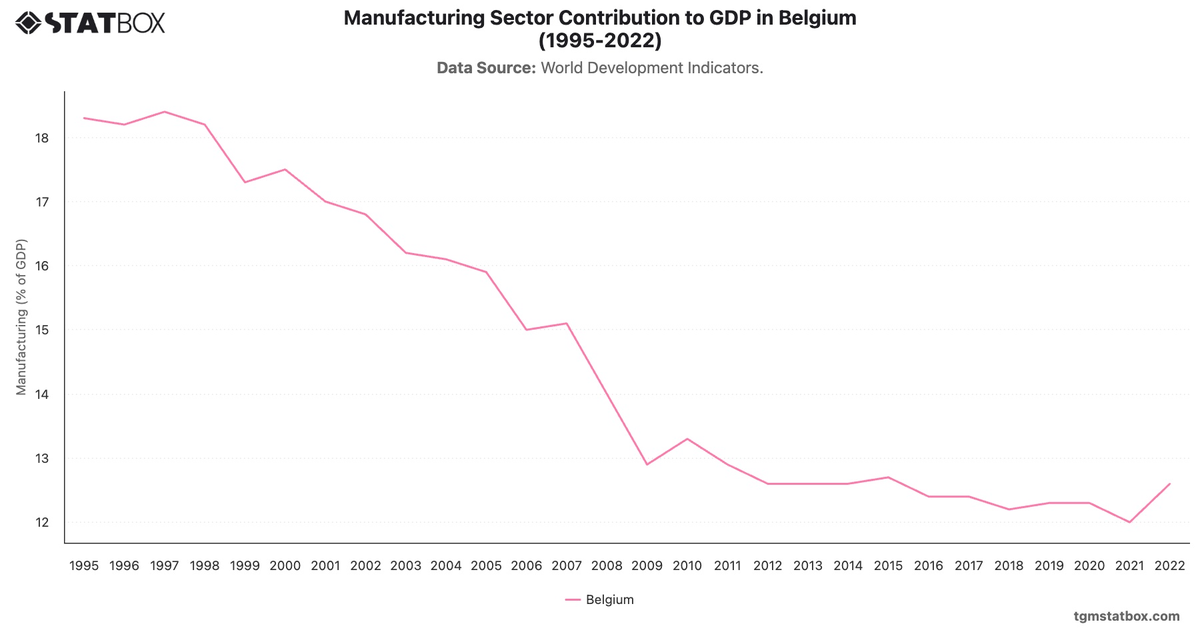
Explore related charts to gain a better understanding of Industry sector’s GDP share in Belgium, Belgium’s unemployment rate trend, Belgium’s population count.