The Changing Death Rate in Belgium from 1990 to 2022

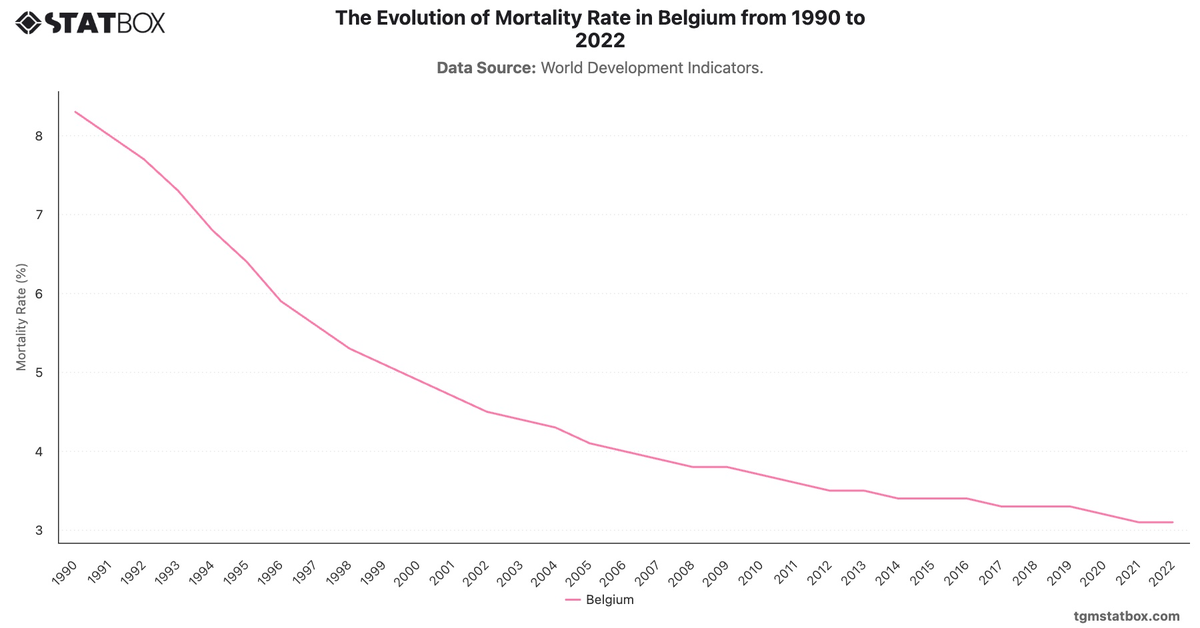
The Changing Death Rate in Belgium from 1990 to 2022

Share the statistic on social media channels or embed the statistic in your website using "Embed Code", where available.

Share chart

Embed chart
Select Citation

Cite this statistic and select one of the following formats: APA, Chicago, Harvard, MLA & Bluebook


  • APA
  • Chicago
  • Harvard
  • MLA
  • Bluebook
  • IEEE
TGM StatBox. (2024). The Changing Death Rate in Belgium from 1990 to 2022. TGM StatBox.
Insights

Key Takeaways

Belgium’s death rate remained consistent from 1990 to 2019, hovering around 10.0, with minor dips reflecting healthcare improvements. A sharp increase in 2020 (11.0) aligns with the pandemic's first wave, which significantly impacted Belgium's elderly population. Despite some recovery to 9.7 in 2021, the rate rose again to 10.0 in 2022, hinting at lingering health challenges and demographic shifts.

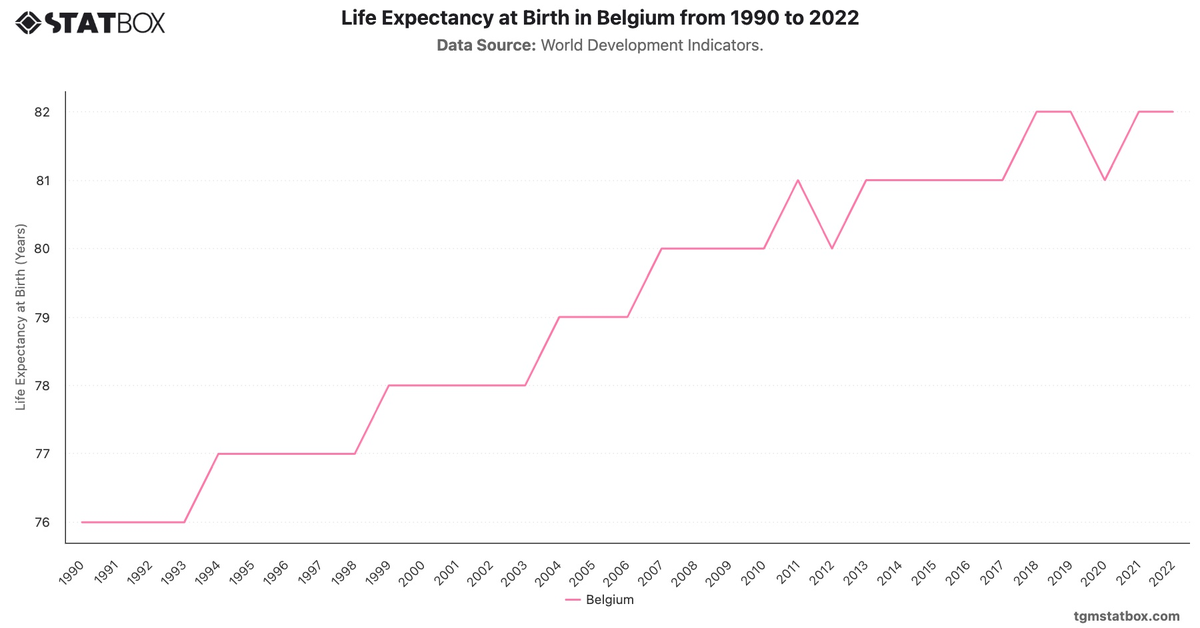
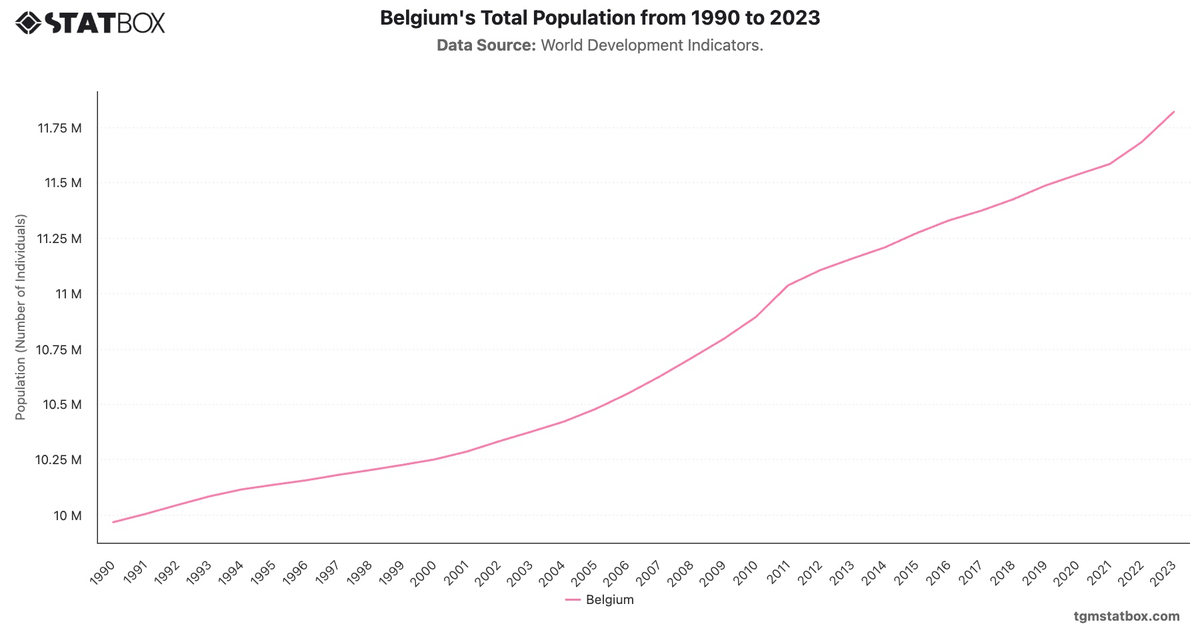
Explore related charts to gain a better understanding of Belgium’s population growth, Belgium’s average lifespan at birth, Belgium’s unemployment rate trend.

Further Recommended Statistics

Statbox vector
Statbox |form contact icon

Have Other Queries?

Statbox vector

Connect with our expert team for immediate assistance or comprehensive market analysis. We are always ready to support your business needs.