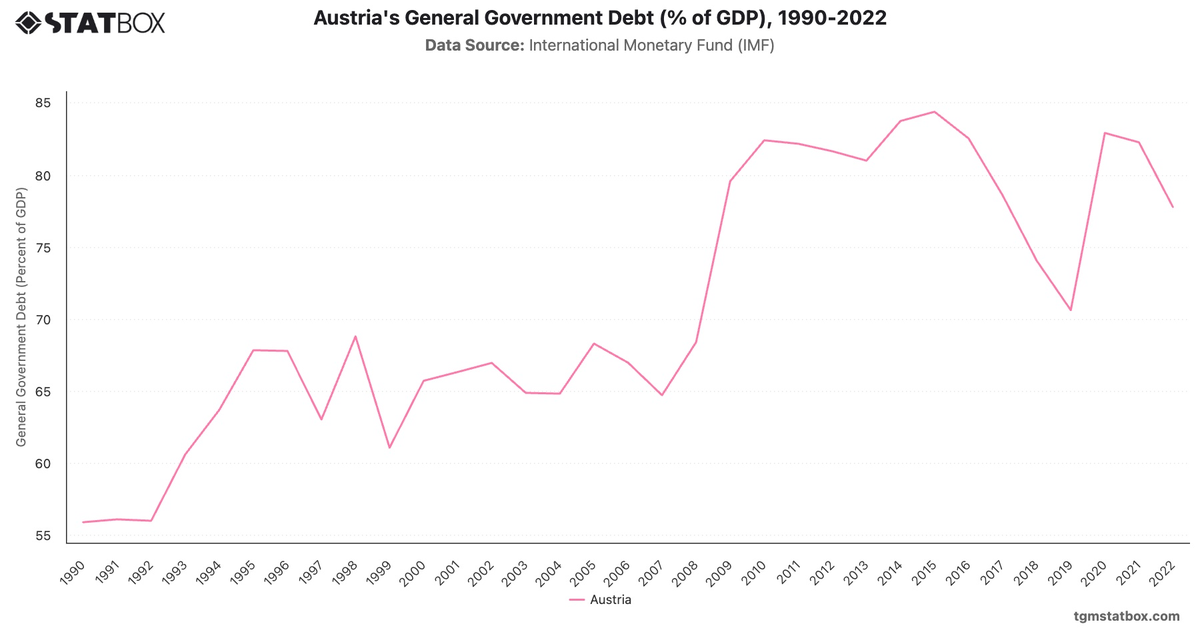
Austria's debt ratio rose steadily from 45.53% in 1990 to 57.87% in 1999, driven by reunification-era spending and structural adjustments in the European Union context. Debt stabilized in the early 2000s but surged again after the 2008 financial crisis, peaking at 62.45% in 2020 amid pandemic-related spending.
Efforts to contain debt were evident by 2022, with levels moderating to 60.52%. Austria's disciplined fiscal policies and economic integration within the EU have played a key role in managing its debt trajectory.
Efforts to contain debt were evident by 2022, with levels moderating to 60.52%. Austria's disciplined fiscal policies and economic integration within the EU have played a key role in managing its debt trajectory.
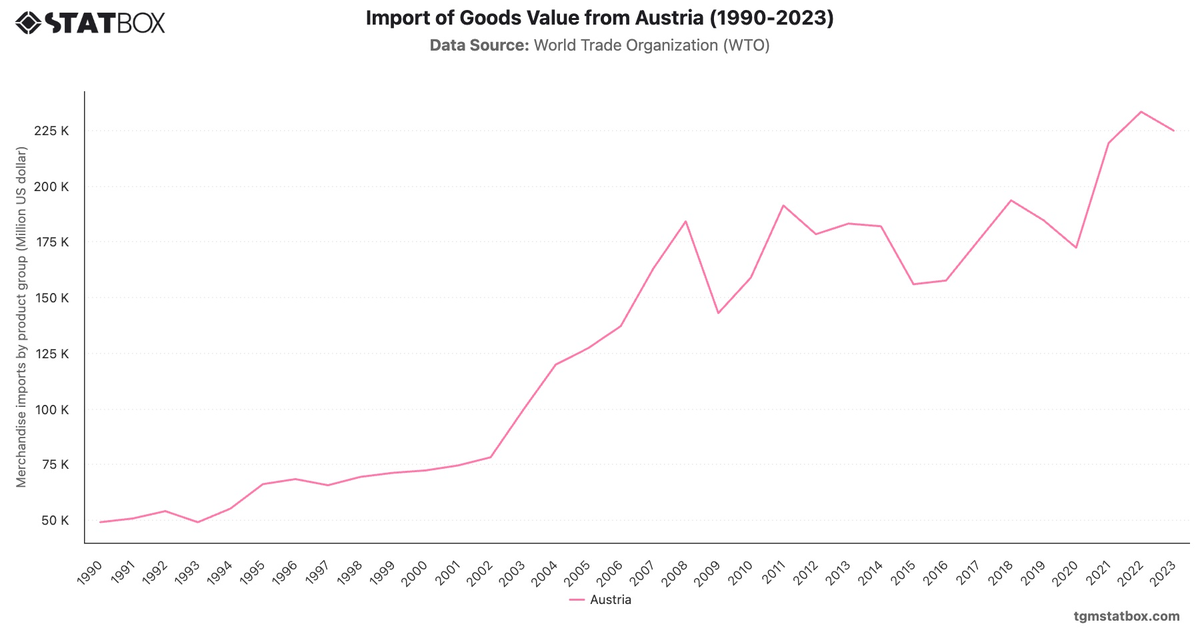
Gain a broader perspective by reviewing Austria’s services sector GDP share, Austria’s population figures, Austria’s import value.