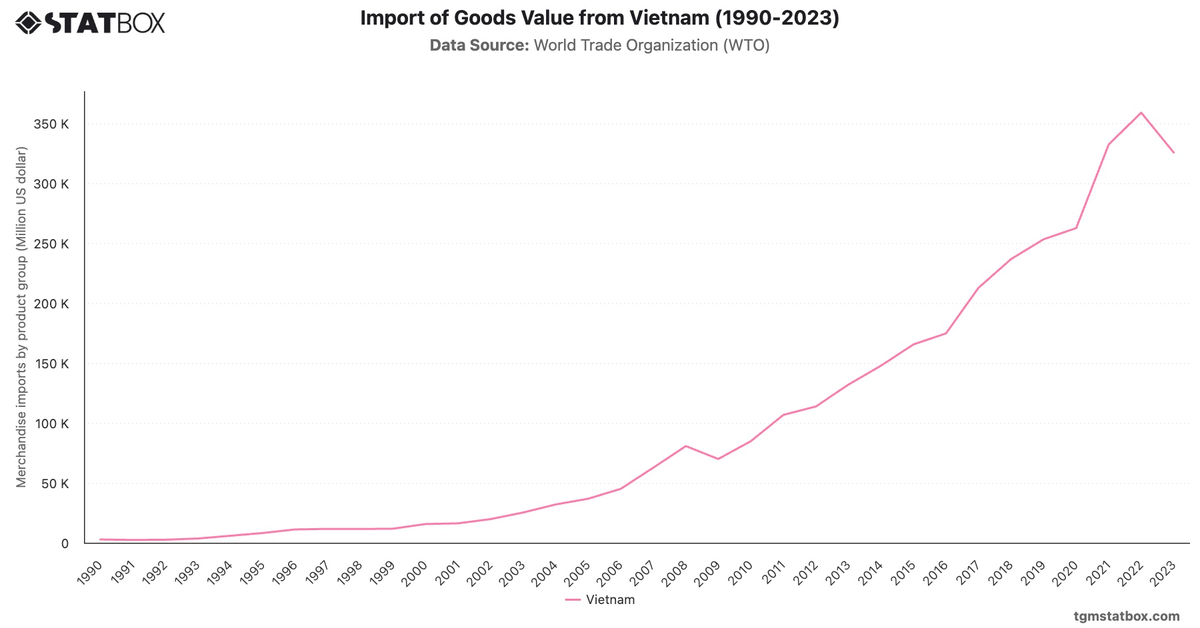
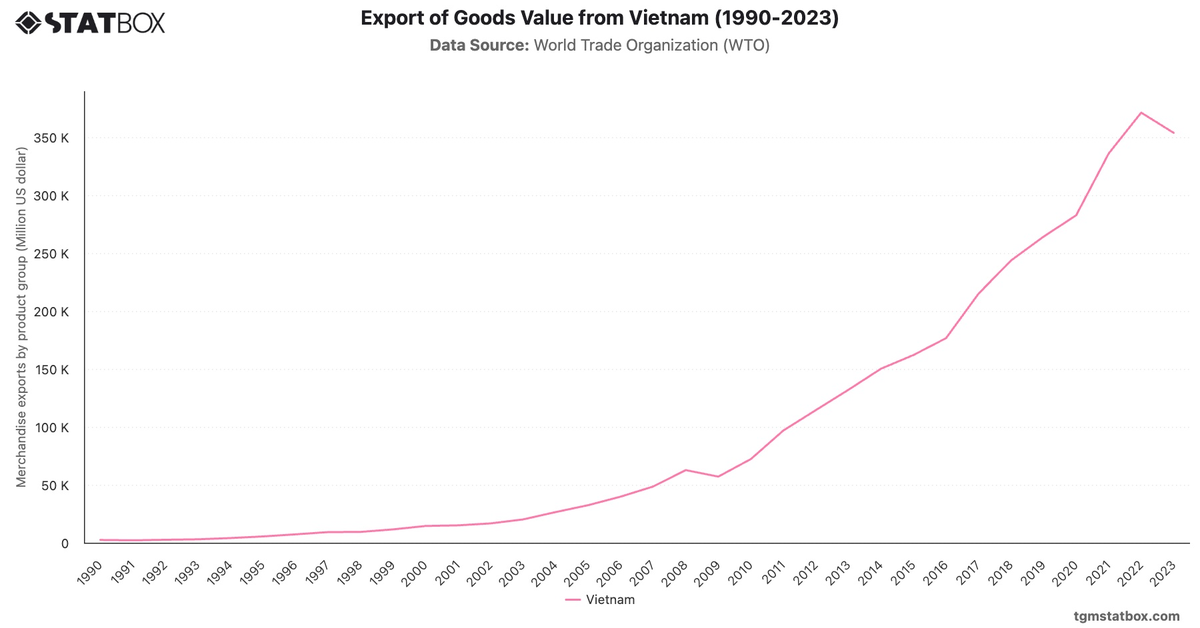
Vietnam consistently posted trade surpluses from 2017 to 2023, with the balance growing from 2,094.6 million USD in 2017 to 28,005.8 million USD in 2023. The strong performance is attributed to robust exports in electronics, textiles, and agricultural products. After a dip to 3,522.7 million USD in 2021, the surplus rebounded in 2022 and 2023 as global demand recovered.
Vietnam’s trade performance highlights its status as a leading exporter in Southeast Asia, supported by competitive manufacturing and favorable trade agreements. Its growing surplus reflects strong integration into global supply chains and a well-diversified export base.
Vietnam’s trade performance highlights its status as a leading exporter in Southeast Asia, supported by competitive manufacturing and favorable trade agreements. Its growing surplus reflects strong integration into global supply chains and a well-diversified export base.
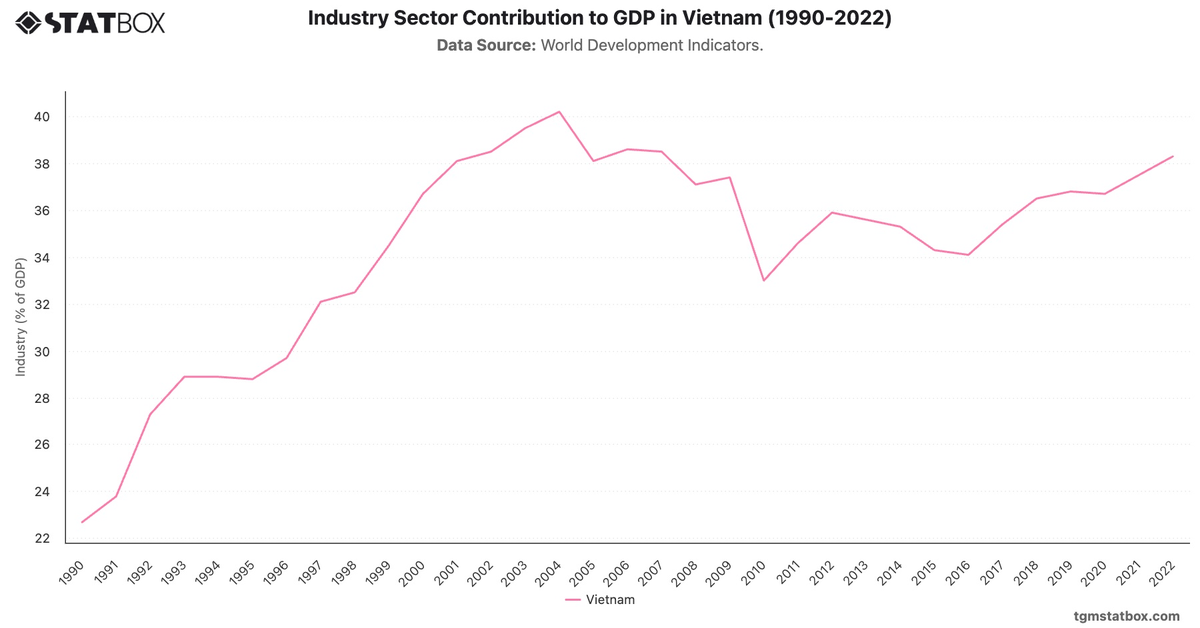
Discover additional trends and data on Vietnam’s agriculture share in GDP, Vietnam’s industry sector contribution to GDP, Vietnam’s annual GDP growth rate.