Ukraine’s Net ODA (% of GNI) remained low until 2014, when it rose to 1.1%, reflecting international aid following the annexation of Crimea and the onset of conflict in Eastern Ukraine. Peaks in 2015 (1.5%) and 2020 (1.5%) align with economic stabilization and pandemic-related support.
The dramatic surge to 17.0% in 2022 corresponds to global aid in response to the Russian invasion, underscoring the critical role of ODA in Ukraine’s ongoing crisis management.
The dramatic surge to 17.0% in 2022 corresponds to global aid in response to the Russian invasion, underscoring the critical role of ODA in Ukraine’s ongoing crisis management.
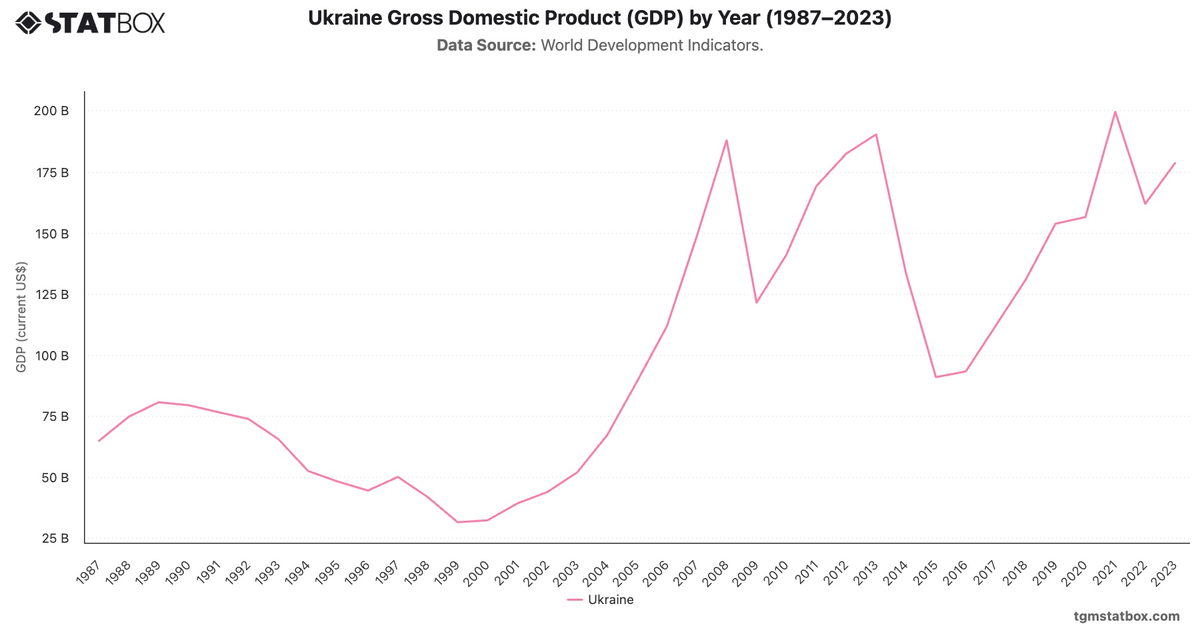
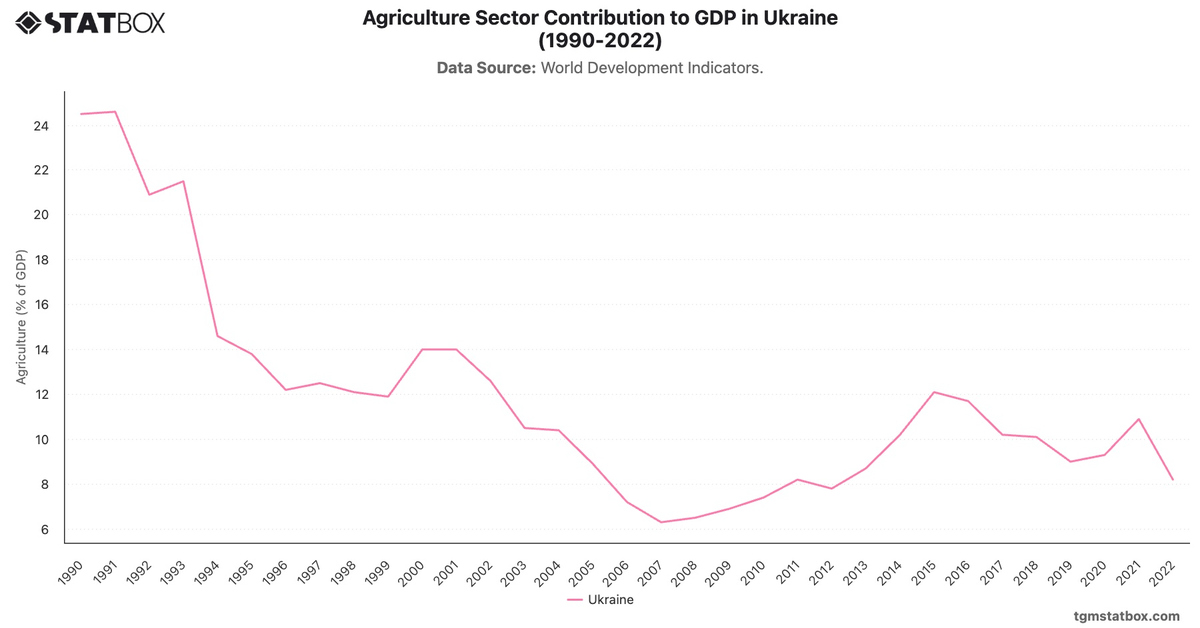
Find out more through related statistics on Ukrainian GDP figures by year, Ukraine's agriculture’s share in GDP, Ukraine’s public debt as a percentage of GDP.