New Zealand's Overall Balance (% of GDP): Net Lending/Borrowing Trends and Forecasts (1990-2029)

New Zealand's Overall Balance (% of GDP): Net Lending/Borrowing Trends and Forecasts (1990-2029)

Share the statistic on social media channels or embed the statistic in your website using "Embed Code", where available.

Share chart

Embed chart
Select Citation

Cite this statistic and select one of the following formats: APA, Chicago, Harvard, MLA & Bluebook


  • APA
  • Chicago
  • Harvard
  • MLA
  • Bluebook
  • IEEE
TGM StatBox. (2024). New Zealand's Overall Balance (% of GDP): Net Lending/Borrowing Trends and Forecasts (1990-2029). TGM StatBox.
Insights

Key Takeaways

New Zealand's fiscal trends reflect effective economic policies and external shocks. The early 1990s saw significant deficits, peaking at -6.3% in 1992, followed by robust surpluses in the mid-2000s, reaching 5.1% in 2005. This was driven by strong growth and prudent fiscal management.

The global financial crisis and the pandemic reversed these gains, with deficits reaching -4.3% in 2020. Projections suggest a steady narrowing of deficits to -0.1% by 2029, reflecting ongoing recovery and fiscal responsibility.

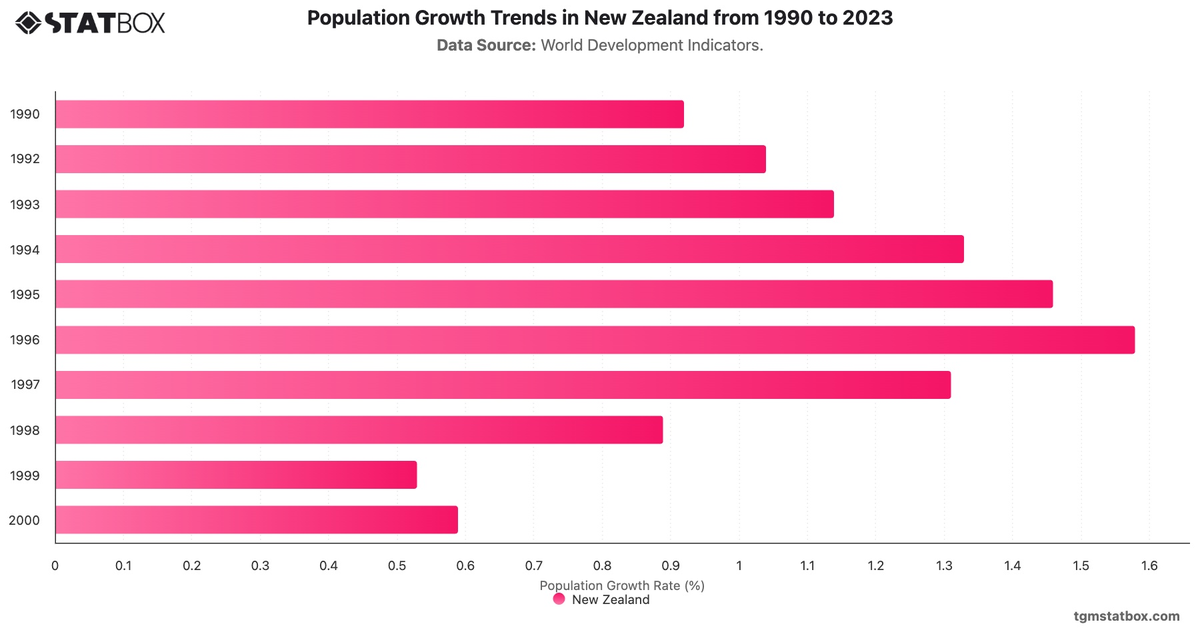
For additional information, visit statistics on New Zealand’s population numbers, New Zealand’s inflation rate trends, Agriculture’s share in New Zealand’s GDP.

Would you like to know more?
Check our report on this topic

Sustainability Report: Insights in New Zealand

New Zealand Sustainability Insights Report 2024

Sustainability Report: Insights in New Zealand

Learn more about sustainability insights in New Zealand with TGM StatBox. Explore in-depth insight report, featuring user behavior, trends, and preferences.

Go to report

Further Recommended Statistics

Statbox vector
Statbox |form contact icon

Have Other Queries?

Statbox vector

Connect with our expert team for immediate assistance or comprehensive market analysis. We are always ready to support your business needs.