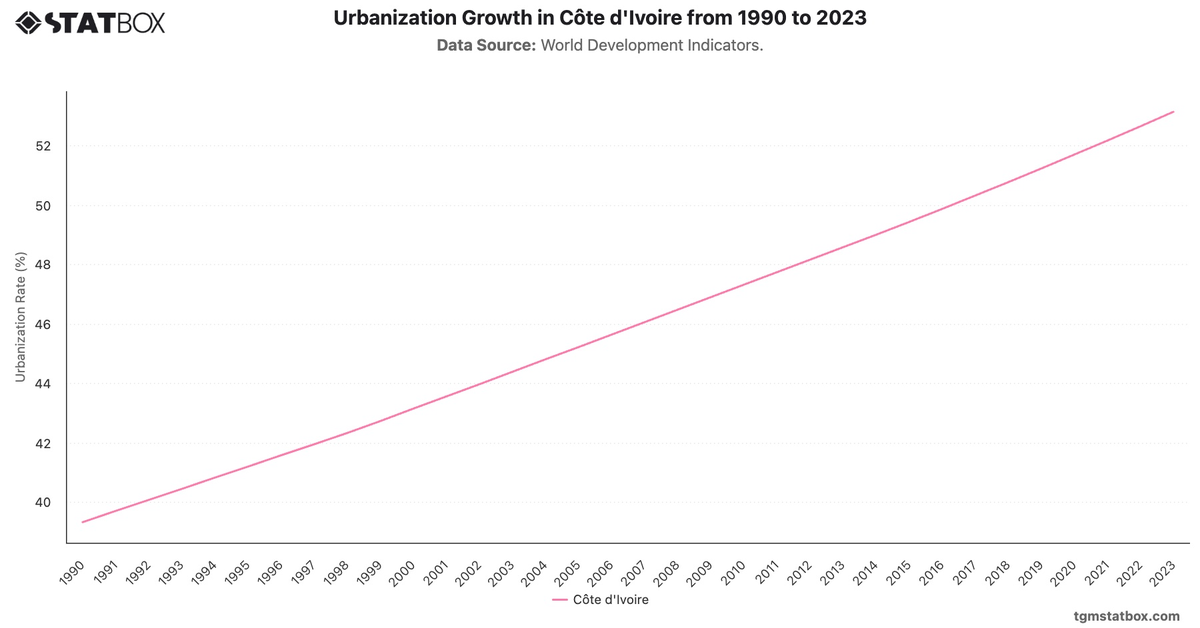
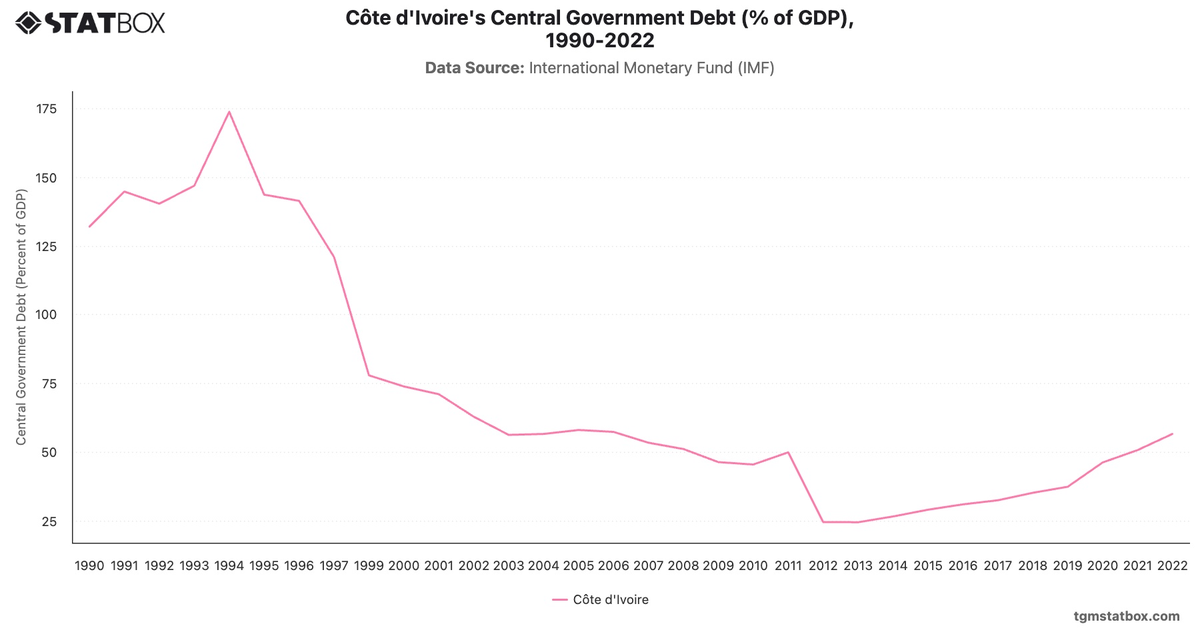
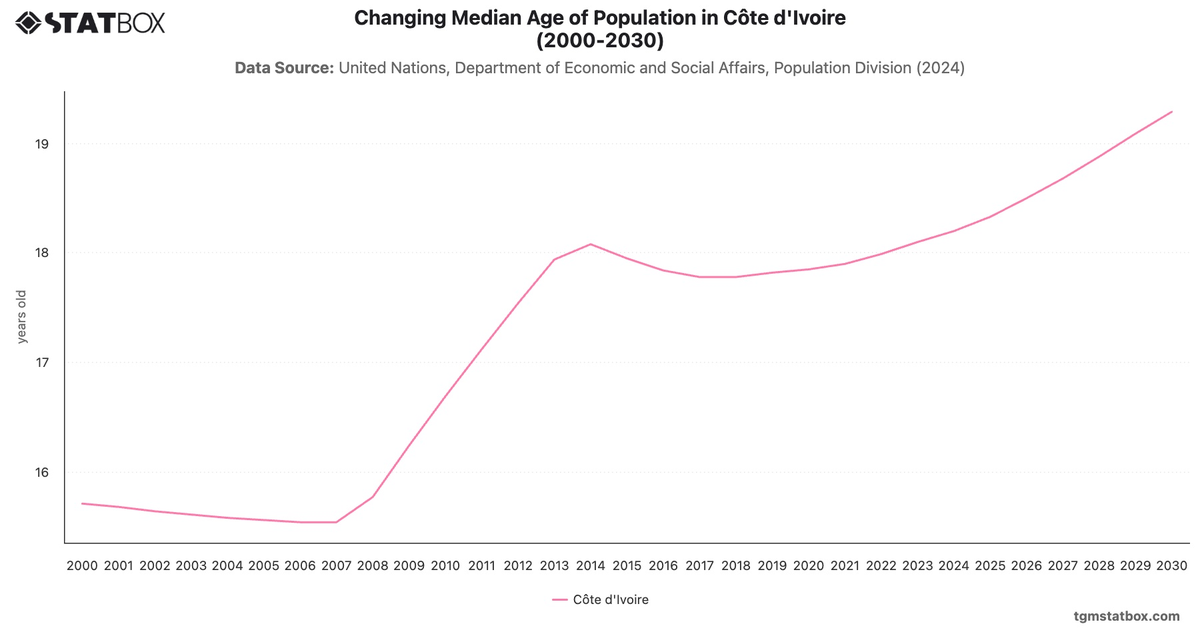
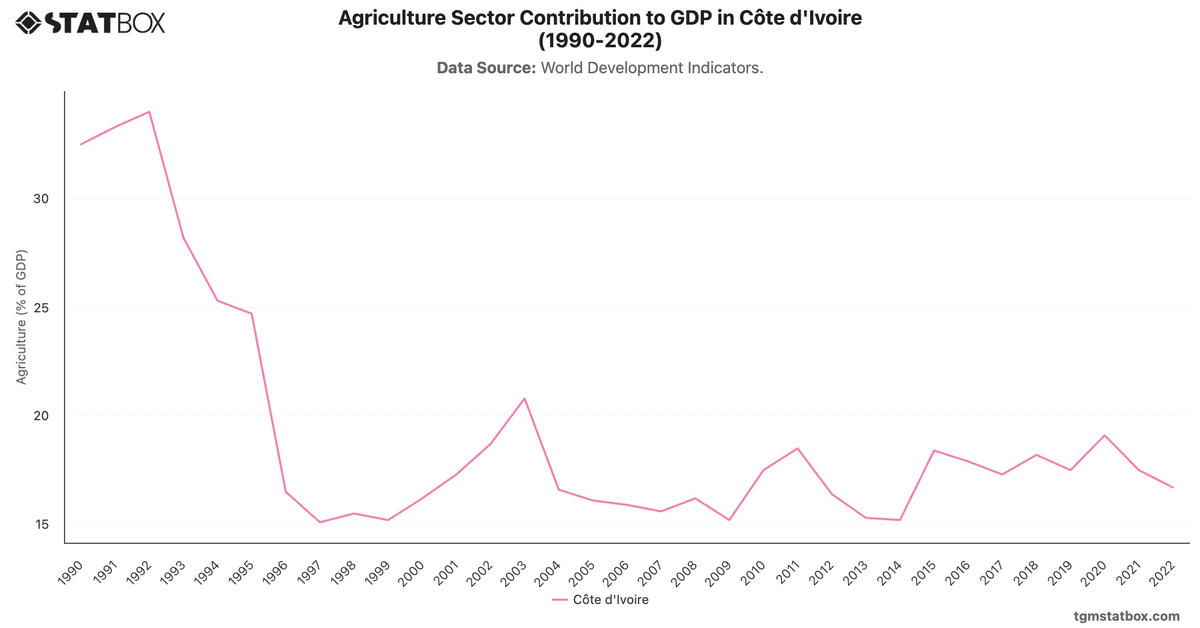
Côte d'Ivoire’s fiscal trends reflect its recovery from political instability and economic challenges. The late 1990s saw deficits averaging -1%, but the post-2010 period brought fiscal strain, with deficits peaking at -6.6% in 2022 due to increased public investment and external shocks.
The outlook suggests gradual narrowing of deficits to -2.5% by 2029, driven by improved governance and economic diversification. The country’s fiscal trajectory emphasizes the role of stability and structural reforms in achieving sustainable growth.
The outlook suggests gradual narrowing of deficits to -2.5% by 2029, driven by improved governance and economic diversification. The country’s fiscal trajectory emphasizes the role of stability and structural reforms in achieving sustainable growth.
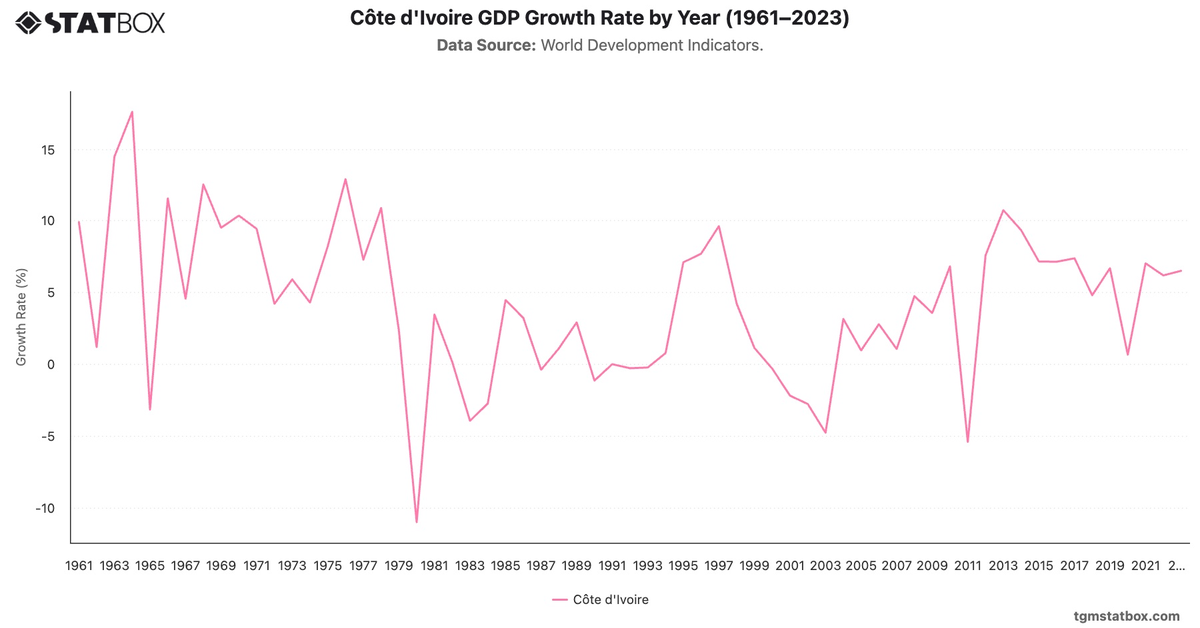
Explore related charts to gain a better understanding of Côte d'Ivoire’s annual GDP growth rate, Côte d’Ivoire’s population numbers, Côte d’Ivoire’s annual GDP.