Brazil's inflation history reflects dramatic volatility, with hyperinflation peaking at 2947.7% in 1990. The Real Plan in 1994 successfully curbed hyperinflation, bringing rates down to 15.8% by 1996. Moderate inflation persisted until the mid-2010s when economic and political crises pushed rates to 9.0% in 2015.
In 2022, inflation reached 9.3% amid global economic disruptions. Projections show a decline to 3% by 2029, reflecting the success of Brazil’s fiscal and monetary policies in maintaining price stability and promoting long-term economic recovery.
In 2022, inflation reached 9.3% amid global economic disruptions. Projections show a decline to 3% by 2029, reflecting the success of Brazil’s fiscal and monetary policies in maintaining price stability and promoting long-term economic recovery.
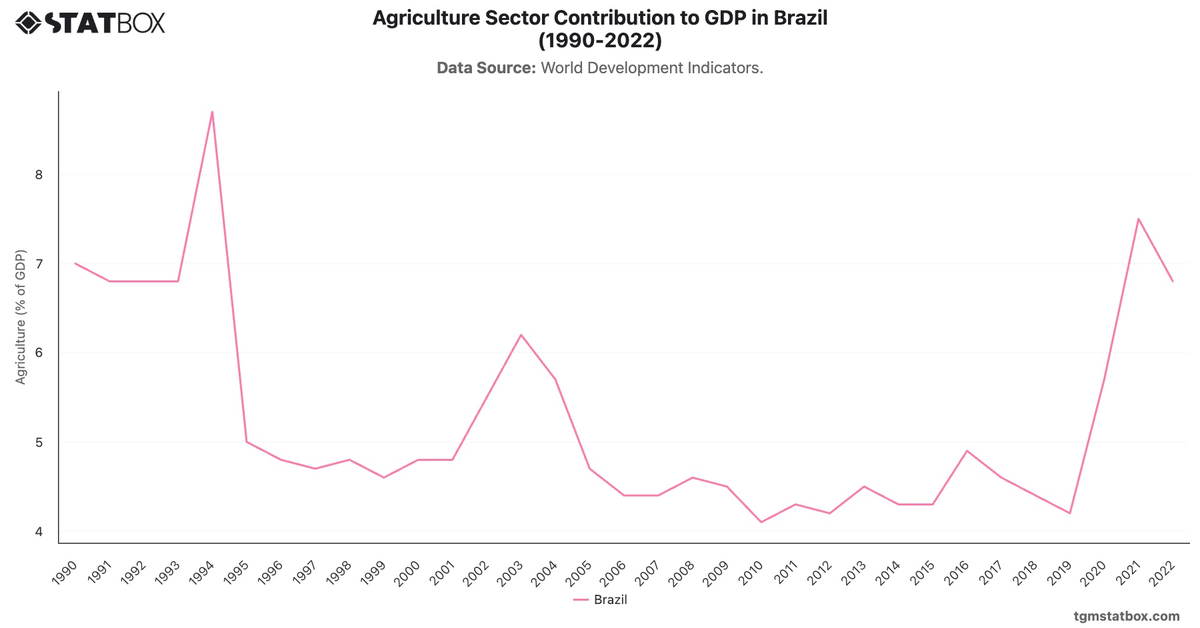
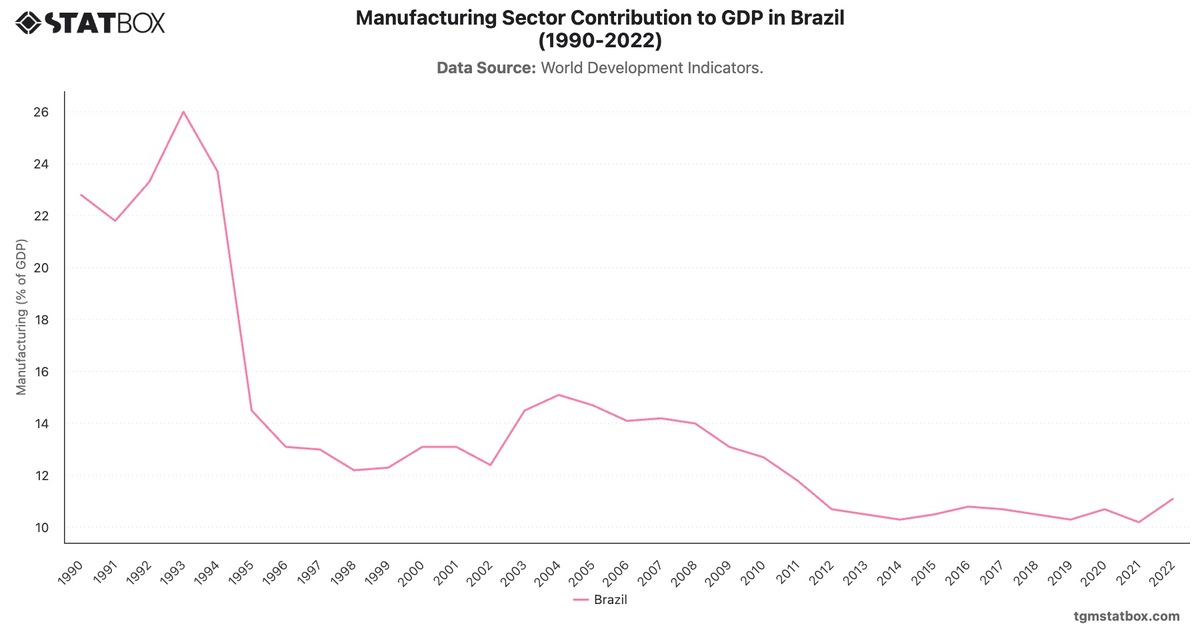
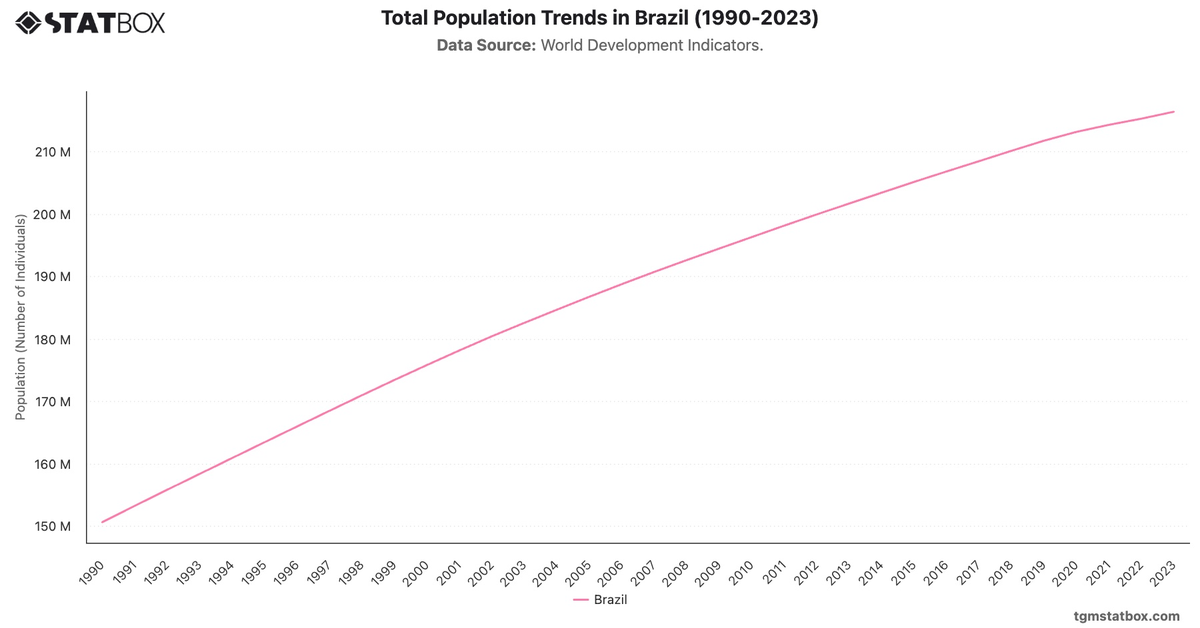
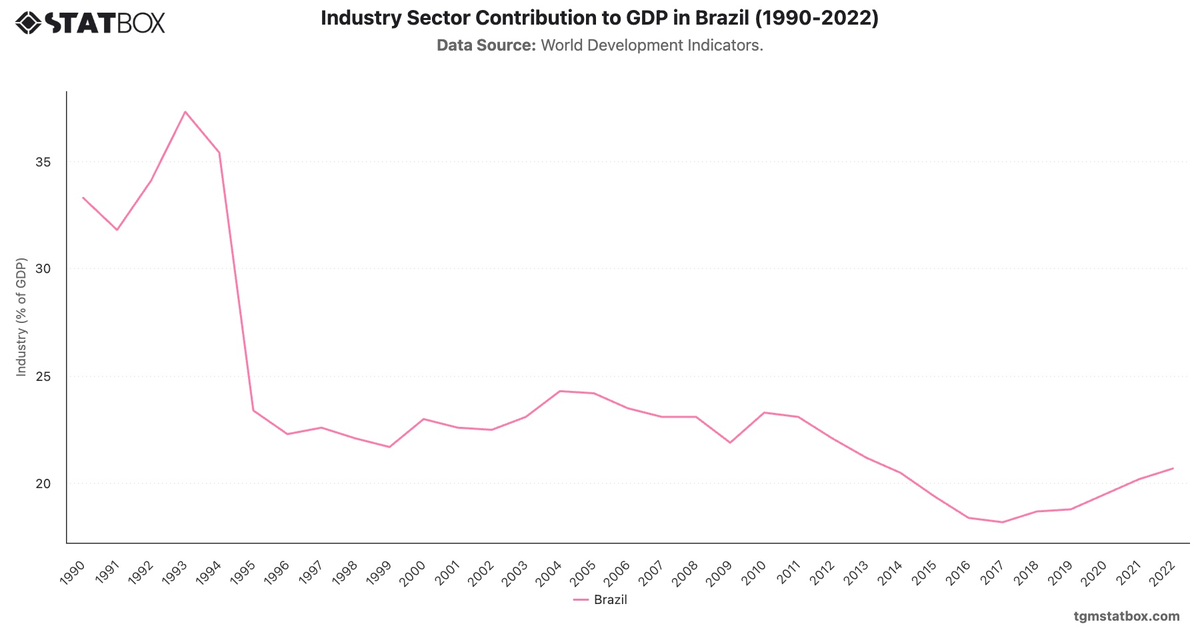
Explore related charts to gain a better understanding of Brazil’s agriculture share in GDP, Brazil’s manufacturing sector GDP share, Brazil’s working-age population ratio.