Botswana’s fiscal balance reflects its dependence on diamond exports and external shocks. After surpluses in the early 2000s, the 2008 global financial crisis led to deficits peaking at -14.4% in 2009. Economic recovery saw improvements, with occasional surpluses by 2013 (6.1%).
The pandemic caused a sharp deficit of -11.4% in 2020. Recovery efforts suggest a stabilization near 0.5% by 2029, contingent on sustained economic diversification and prudent fiscal management.
The pandemic caused a sharp deficit of -11.4% in 2020. Recovery efforts suggest a stabilization near 0.5% by 2029, contingent on sustained economic diversification and prudent fiscal management.
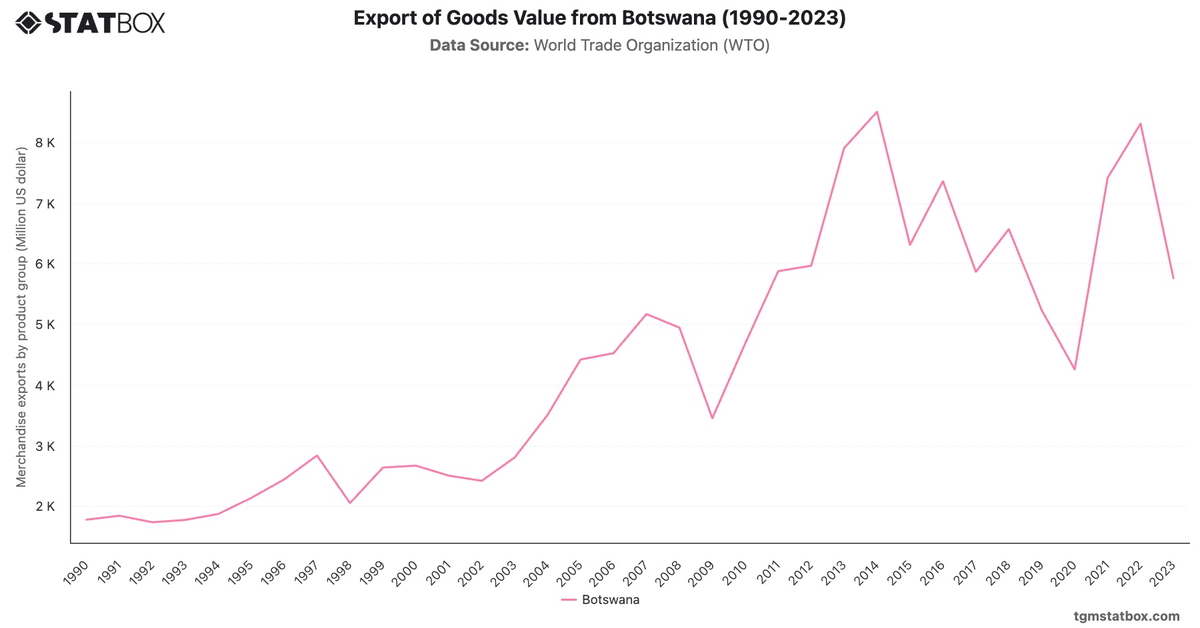
For a deeper dive into the topic, explore Botswana’s annual GDP growth rate, Botswana’s central government debt to GDP ratio, Botswana’s goods export value.